Micromobility Infrastructure Requirements for Cities
Cities need protected lanes, corrals, and charging infrastructure to make micromobility work.
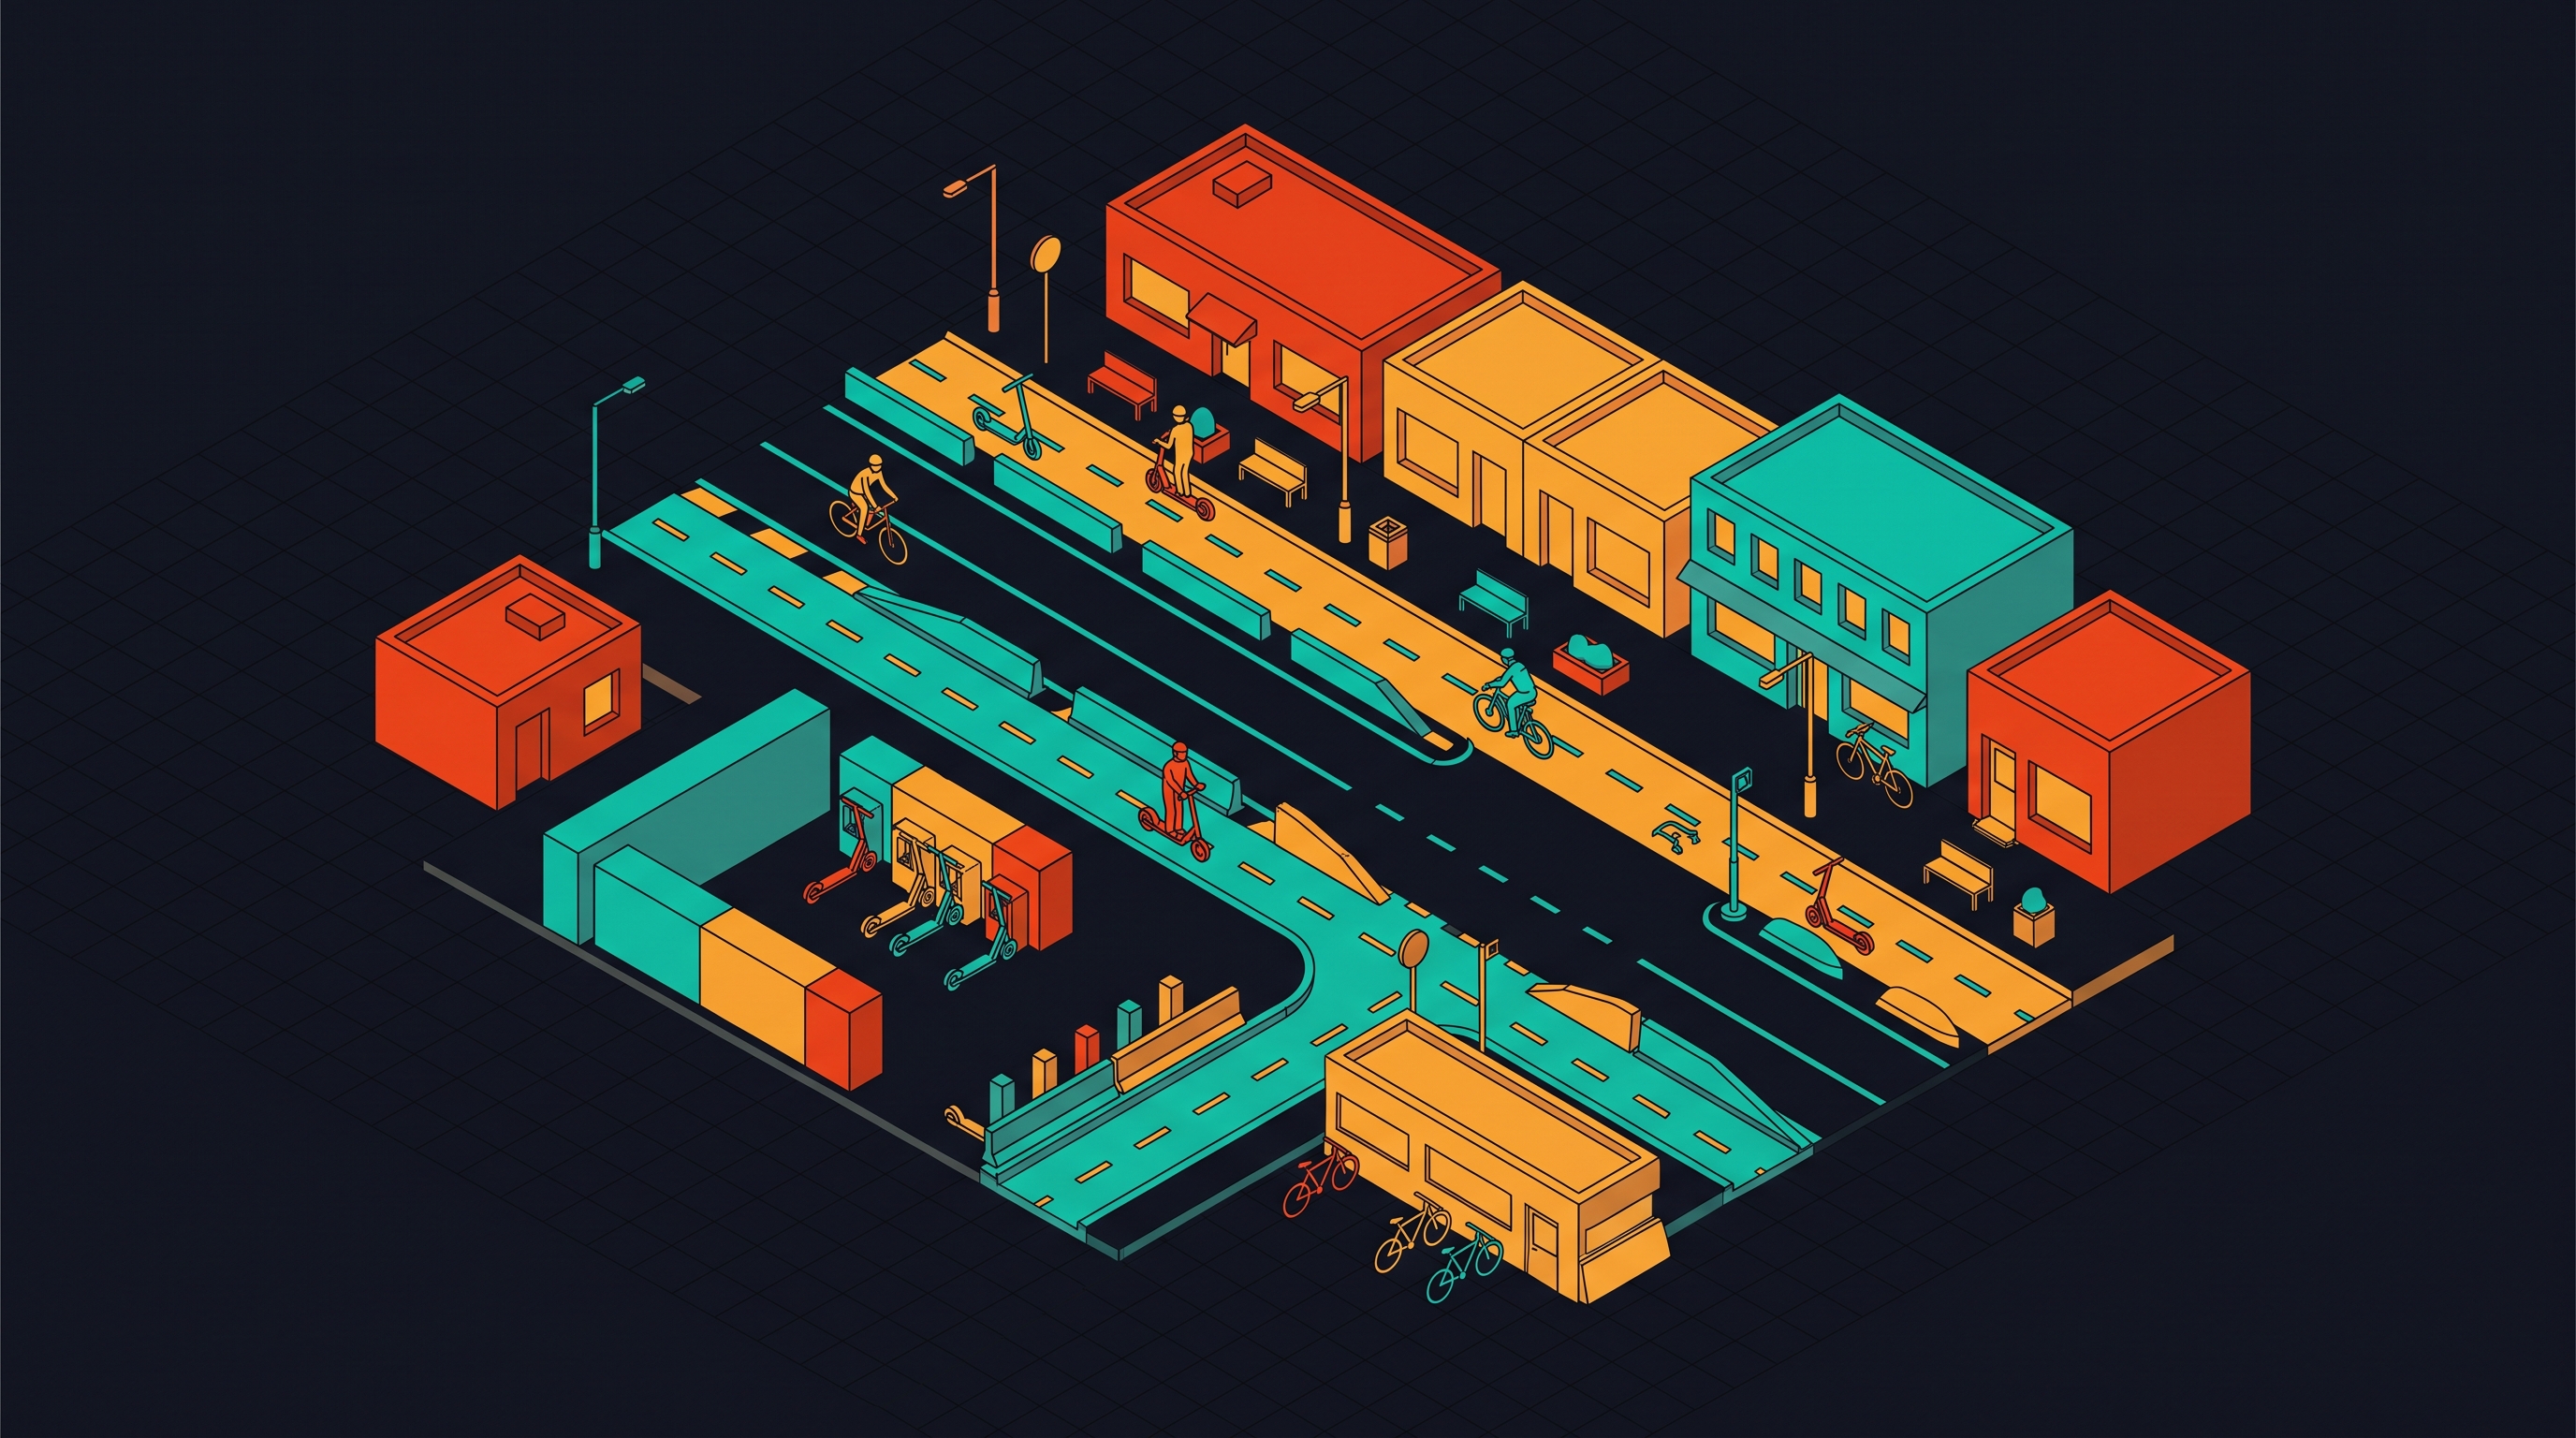
Trajectory data from Austin found that the average e-scooter trip is split across sidewalks, bike lanes, roadways, and surfaces without formal classification. Bike lanes accounted for roughly 11% of the average trip. Riders aren't improvising because they want to — they're working around a network built entirely for cars.
A 2023 study found that more than 60% of bicycle owners named sharing a road with motor vehicles as their main reason for riding less. The obstacle is physical. What passes for cycling infrastructure in most U.S. cities is a strip of white paint between a parked car and a moving bus, squarely in the dooring zone. For someone on a device that's too slow for traffic and too fast for a sidewalk, that's not infrastructure.
The 2021 Bipartisan Infrastructure Law named shared micromobility explicitly for the first time and opened federal funding pathways. But policy recognition and physical buildout are different things. The gap between them is where injuries, complaints, and system failures accumulate.
Protected Lanes Are the Foundation
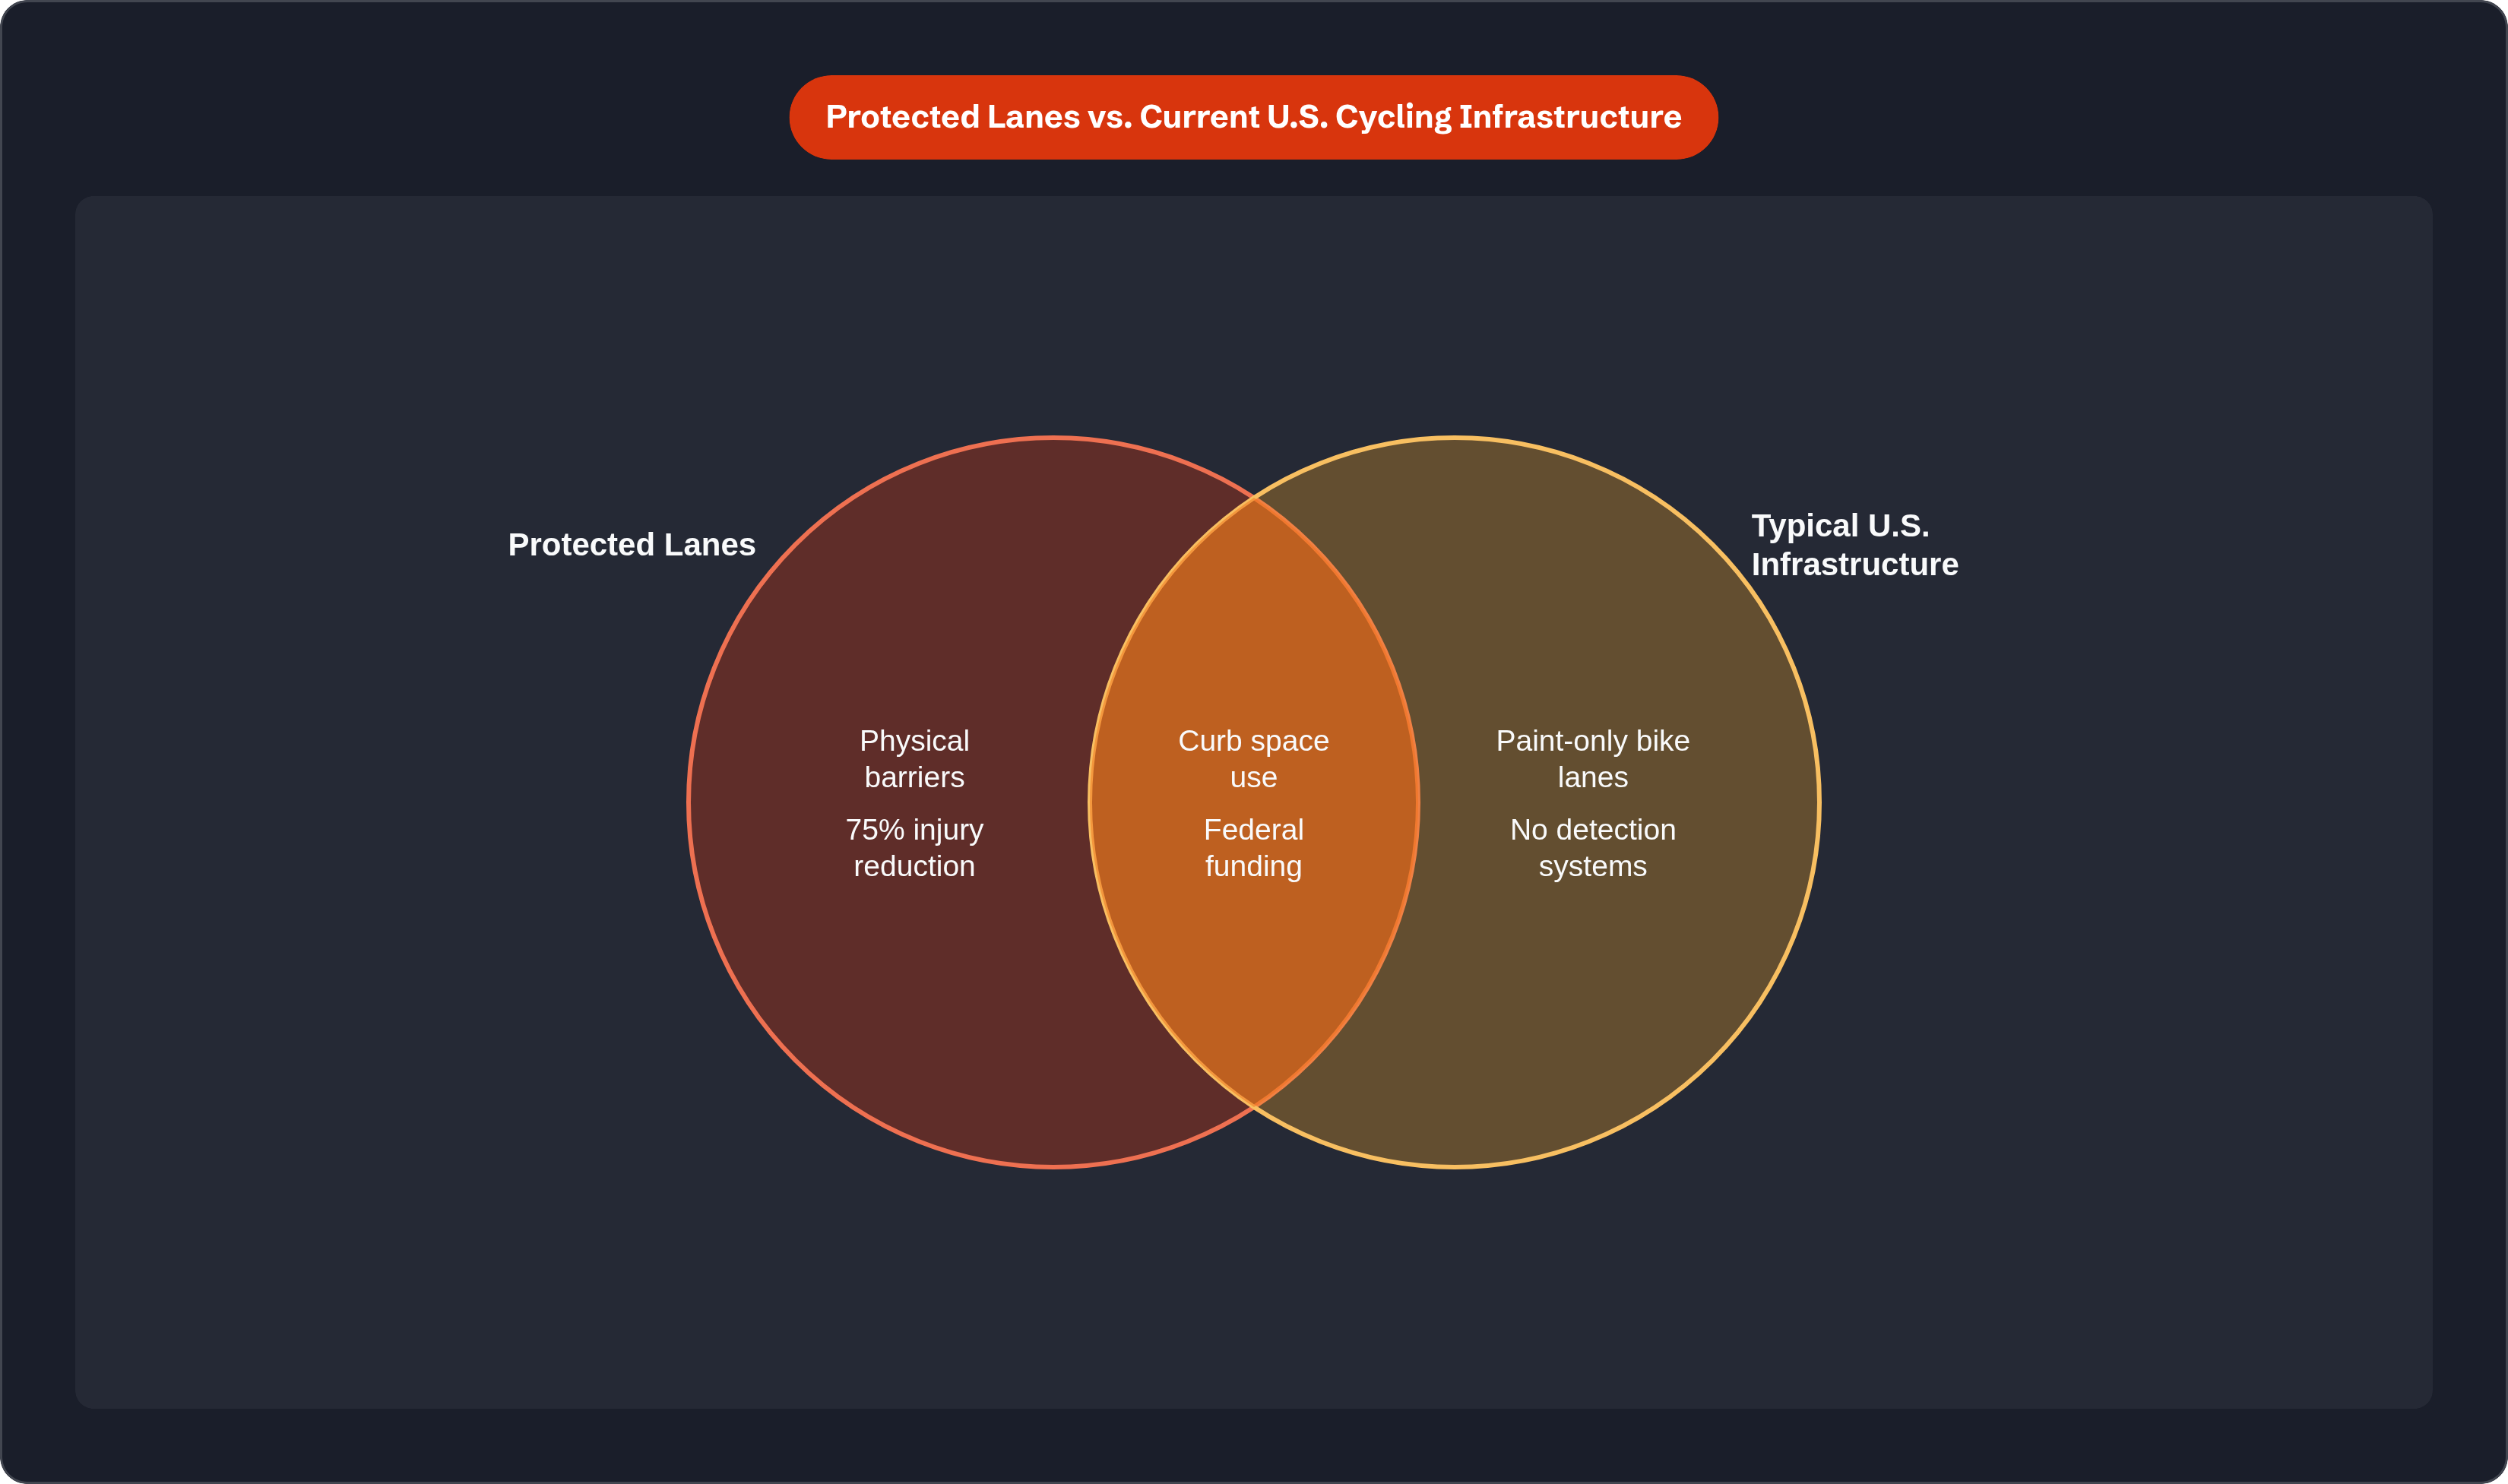
Studies show protected bike lanes cut cycling injuries at intersections by 75%. When NYC installed a parking-protected bike lane on Columbus Avenue, bike use on that corridor jumped 56% and crashes dropped by a third. Seville built a protected lane network and saw bike trips grow fourfold. Nashville and Phoenix both reported meaningful ridership increases and fewer safety incidents along their newest protected corridors, according to a 2025 Streetsblog study sponsored by Lime.
Protected lanes don't just make riding safer — they generate riders. People who won't use a scooter or e-bike in mixed traffic will use one when there's a physical barrier between them and a moving car. Cities assume low demand because ridership is low, but ridership is low because there's nowhere safe to ride. NYC went from its first protected lanes in 2007 to 644 miles of protected bicycle infrastructure by 2022 through sustained political will and budget commitment across multiple administrations.
Lane width is underappreciated. As e-bikes and scooters mix with traditional cyclists, lanes designed for single-speed bikes become bottlenecks at peak hour. The spec keeps moving whether cities update it or not.
Parking and Curb Management
After Pensacola launched its first dockless scooter program, improperly parked scooters became the top complaint to its 311 system. The city introduced mandatory corrals when it made the program permanent in 2022, and complaints dropped. That pattern repeats across every city that has run dockless micromobility at real scale.
A 2024 University of Oregon research report found riders park correctly when there's a corral within roughly a one-minute walk of their destination. Corral density isn't a design preference — it's a compliance mechanism. NABSA's 2024 report confirms compliance improves significantly with corrals spaced roughly every 200 meters.
Cities use a mix of tools: education campaigns (about 75% of cities), geofenced virtual zones (about 69%), physical parking areas (about 63%), and lock-to requirements (about 18%). Physical corrals are the most effective, but they require a city to officially reallocate curb space. Cities that treat parking infrastructure as the operator's problem end up with sidewalk clutter and a backed-up 311 queue.
The survival data is concrete. Docked and dockless bike systems survive their first five years at roughly 76–79% rates. E-scooter systems land around 56%. The operational burden of manual battery collection drives up labor costs and vehicle downtime in ways docked systems don't face. Physical parking infrastructure that supports charging is part of how you close that gap.
Charging Infrastructure
Between 2020 and 2024, e-device fleets expanded fast. The charging infrastructure to support them did not. The current model for most e-scooter operators: workers collect vehicles at night, charge them manually, and redeploy them in the morning. It's expensive, labor-intensive, and doesn't scale. Vehicles spend hours off the street during peak potential use.
Solutions under development include solar-powered charging points in public space, RFID-authenticated stations with secure docking, automated battery-swap systems, and multi-vehicle docking built into transit shelters and street furniture. Most are still commercially early.
Cities rebuilding corridors now are making decisions about conduit, power access, and mounting points that have a long tail. Planning for curbside charging capacity during a corridor rebuild avoids a much more expensive retrofit later. NYC's cargo e-bike program adds context: in 2022, cargo e-bikes made more than 130,000 trips and delivered over five million packages. Electrified urban freight is building the same case for city-side charging infrastructure as personal micromobility. Pressure from multiple directions tends to be when cities actually move.
Traffic Signal Systems and Street Design
Most traffic signal infrastructure uses vehicle detection loops calibrated for cars. Bicycles and scooters don't reliably trigger them. If you're on a scooter at a red light, the signal doesn't know you're there. You sit indefinitely, or you run the light.
Oregon DOT ran a two-year test of a blue light bicycle detection system. Eighty-one percent of cyclists surveyed said it improved their experience at intersections. Roughly 60% of e-scooter roadway trips happen on principal arterials — the highest-speed, highest-conflict roads in any city. When a rider on a 15 mph scooter is invisible to a signal system calibrated for 40 mph cars, the intersection geometry is working against them.
What needs to change: detection systems that register bicycles and scooters reliably; signal phasing that includes protected intervals for slow-speed devices; intersection geometry redesigned for mixed-use lanes; and leading bicycle intervals that give riders a head start before motor vehicle traffic moves. Paris, Singapore, and Los Angeles all expanded smart mobility programs in 2024 to include sensor-enabled bike lanes, making sensor integration part of the infrastructure specification rather than a later addition.
Regulatory Frameworks
Most cities that have managed micromobility well didn't start with a permanent framework. They piloted for three to twelve months — enough time to see what breaks before locking anything in. NACTO has published guidelines covering what a permit needs to address: infrastructure investments, fleet size, rebalancing requirements, maintenance standards, safety, equity provisions, fee structures, data management, and geofencing.
Geofencing has become one of the more powerful regulatory tools available. Seattle's 2025 free-floating shared micromobility permit requirements designate no-parking zones that operators must enforce through their own technology. The city governs through the operator's software — a rider parks in a restricted zone, the app flags it, a surcharge applies. That feedback loop only works if the geofence is accurate, the operator complies, and the city monitors it.
The European cases are worth studying. Berlin capped scooters within its light rail circle in early 2024. Paris banned shared e-scooters outright. Madrid banned rental e-scooters. Barcelona added caps and fees. Melbourne ended its shared e-scooter program entirely. These outcomes follow a consistent pattern: early deployment outpaces governance, public backlash lands on elected officials, and prohibition becomes the easiest response. The calibration challenge is building frameworks permissive enough to let systems scale but structured enough to enforce real standards.
Data-Sharing Requirements
MobilityData's General Bikeshare Feed Specification (GBFS) v3.0 requires dockless vehicle status feeds to update within five minutes. Near-real-time vehicle location is now a baseline permit expectation, not a bonus feature. The Open Mobility Foundation's Mobility Data Specification (MDS) gives cities a standard exchange layer for operating and policy data with scooter and bikeshare providers. Without a shared standard, cities can't aggregate information across their whole fleet or see the system as a system.
Trip data, aggregated with privacy protections, shows which streets carry micromobility demand and enables cities to prioritize lane investment rather than relying on advocacy pressure. Geofenced no-parking zones, speed limits in pedestrian areas, and corral compliance rates all run through the same data infrastructure.
The gap that doesn't get discussed enough: many cities lack the technical capacity to act on what operators provide. Collecting data nobody reads isn't governance. Cities also need flexibility built into data requirements from the start — when vendors exit markets, data pipelines and geofence configurations need to transfer cleanly or sunset gracefully.
The Injury Record
The CPSC estimates over 698,500 injuries related to micromobility products were treated in U.S. emergency departments between 2017 and 2024. Of 533 reported fatalities, e-bikes accounted for 311 deaths and e-scooters accounted for 207. Between 2017 and 2021 alone, micromobility injuries increased 127%. The injury curve tracks the deployment curve almost exactly.
The leading cause of e-scooter death is motor vehicle accidents — not falls, not equipment failure. That single fact is the most direct argument for protected lanes. Head and facial injuries are disproportionately common in e-scooter crashes, and helmet use among injured riders is low. Night riding, impairment, and poorly maintained surfaces compound the risk, and most of these are addressable through design.
Columbia and NYU researchers have pointed out that building protected bicycle infrastructure near high-usage downtown locations reduces injuries faster than behavioral interventions. Helmet campaigns are fine. Protected lanes work faster, and the causality runs directly through road design.
Equity Requirements
Low-income neighborhoods consistently end up with worse micromobility infrastructure — fewer protected lanes, lower corral density, less frequent rebalancing. Chicago's Divvy reaching all 50 city wards, with stations deliberately sited near transit hubs, is the clearest model of what intentional coverage looks like. Station placement is always a policy choice, made explicitly or by default.
Equity requirements in permits now commonly include minimum station density in low-income ZIP codes, reduced-fare programs, and cash payment access. Requiring a smartphone and a credit card quietly excludes a significant share of potential riders. Physical infrastructure placement is the mechanism through which equity is either achieved or foreclosed — protected lanes and parking corrals built only in high-income corridors extend the coverage gap while the system claims success.
The U.S. DOT's Safe Streets for All program distributed $813 million in grants in 2023, explicitly supporting pedestrian infrastructure and safe bicycle corridors with equitable distribution as a condition. The policy rationale for micromobility — reduced car dependence, mode shift, improved transit access, lower emissions — requires coverage, not just strong performance where conditions are already favorable.
What Getting the Infrastructure Mix Right Achieves
The cities generating benchmark ridership numbers — NYC, Chicago, Washington D.C. — are the same cities that have invested in protected lanes, dense corral networks, and clear data-sharing frameworks. The 540 million annual U.S. trip projection by 2035 is explicitly conditional on significant infrastructure investment.
The infrastructure categories are interdependent. Lanes without parking management produce sidewalk obstruction. Parking without charging produces stranded e-fleets and operator attrition. Data requirements without city capacity to act on them produce compliance theater. Infrastructure without governance produces backlash. Governance without infrastructure produces low ridership.
Cities that have done this well tend to follow the same sequence: physical separation first, then parking density, then signal accommodation, then data integration, then equity distribution. Cities that skip steps don't actually skip them — they revisit them later under political pressure, which is the worst time to make infrastructure decisions. The demand is real, the vehicles exist, and the riders are there. The open question is whether federal funding and local political will can scale fast enough to meet a ridership trajectory that will outpace the built environment if cities wait.