Micromobility Options in Major US Cities
E-bikes drive three times more trips than pedal bikes, reshaping how cities move short distances.
Citi Bike is the largest bikeshare system in the United States by a wide margin — over 44 million rides in 2024, more than double 2019 ridership. October 2024 alone saw 5.2 million trips, the system's highest monthly total ever.
The e-bike numbers are worth examining. E-bikes made up 40% of the fleet but generated 66% of all trips, averaging three times the daily trips of a pedal bike. When electric is available, riders choose it — that pattern holds in every city. New York is just the loudest proof.
The system pulled in $200 million in revenue in 2024: roughly 68% from casual per-minute charges, 21% from annual memberships, and 11% from sponsorships. Membership has climbed from $95 in 2013 to $220 today — a 77% real increase after adjusting for inflation. A typical 15-minute e-bike ride for a casual user runs about $10.69, roughly 3.7 times what a member pays. If you ride more than a handful of times a month, the annual pass pays for itself quickly.
Scooters arrived in New York later than almost anywhere else. The Bronx got a pilot in 2021, Queens was added in 2024, and Lime reported over 169,000 trips in March 2025 across those two boroughs — more than double March 2024 numbers. A fall 2025 expansion will bring scooters into additional Bronx, Brooklyn, and Queens neighborhoods. After that, 64% of New Yorkers will live within a five-minute walk of a Citi Bike station.
One number frames the whole system: 85% of Citi Bike riders use it alongside public transit. Bikeshare in New York isn't competing with the subway — it's first/last-mile connectivity, filling the gap between the subway exit and the destination.
Washington D.C.: a multi-operator dockless market built around transit
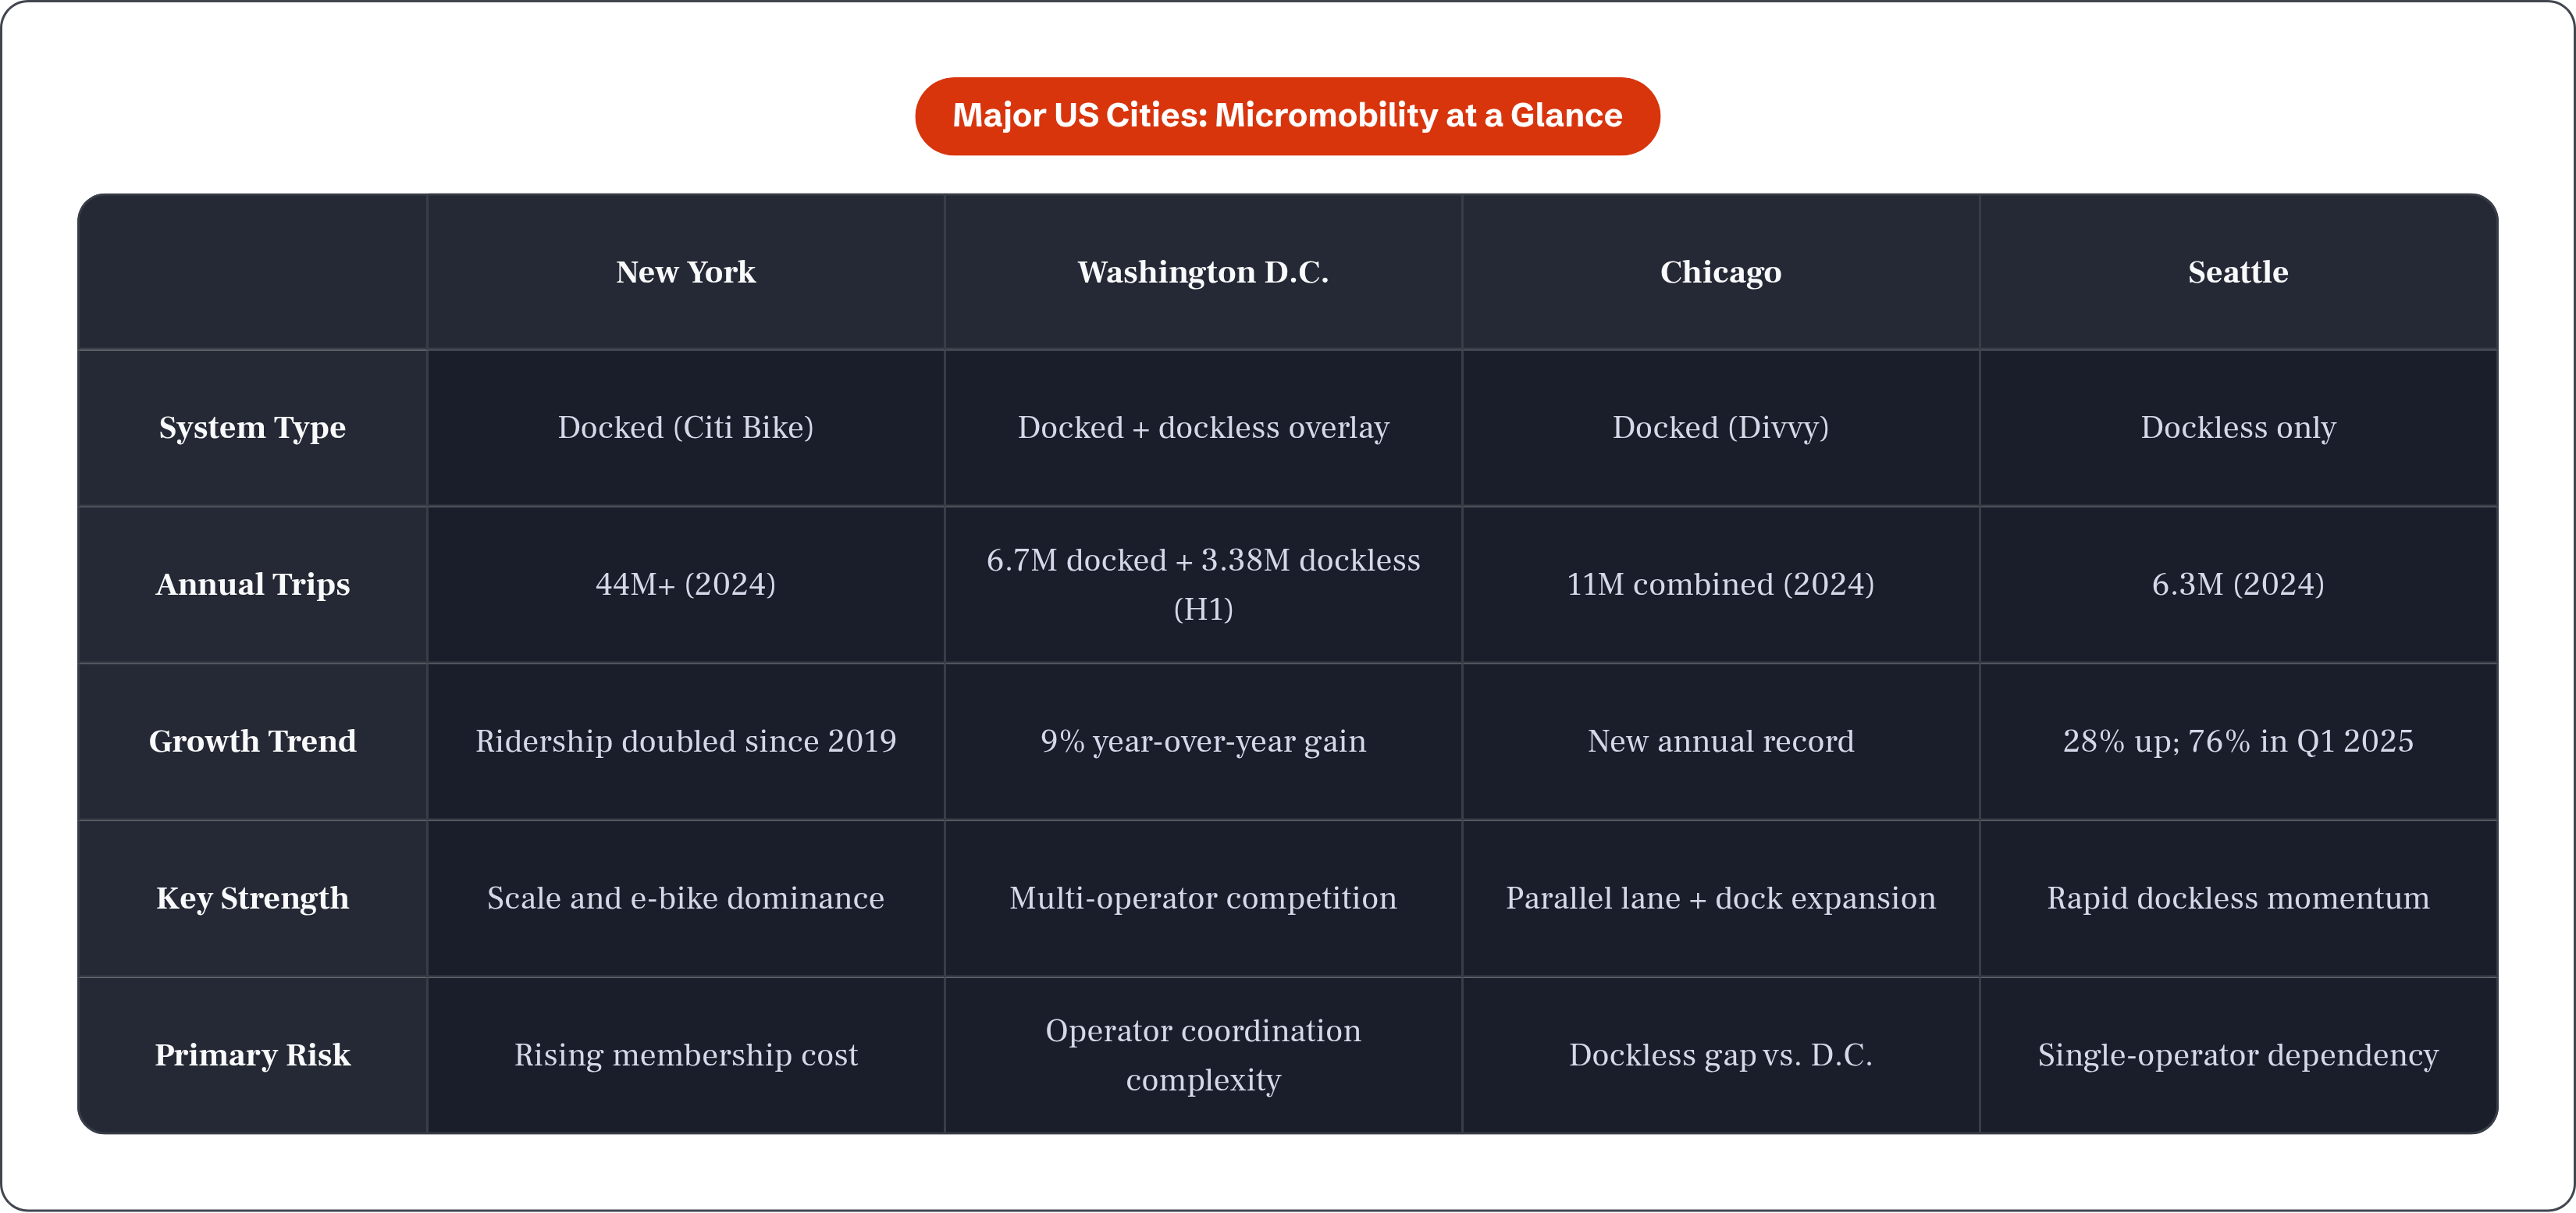
D.C. runs two systems simultaneously. Capital Bikeshare set a new annual record in 2025 with nearly 6.7 million rides, a 9% increase over 2024. Layered on top is a competitive dockless market: four operators — Lime, Spin/Bird, Veo, and Lyft — logged an estimated 3.38 million scooter and e-bike trips through just the first half of 2024, already surpassing the city's entire 2022 total. Lime alone accounted for nearly 70% of those dockless trips.
City policy allows up to 20,000 dockless vehicles citywide, and the city's long-range transportation plan explicitly describes e-scooters as fundamental to reducing car use. D.C. also introduced a Micromobility Fire Safety Standards Act in 2025, one of the more proactive battery-safety moves among major US cities. The result is one of the most layered micromobility markets in the country: a strong fixed-dock system, a competitive dockless overlay, and transit-oriented design throughout.
Chicago: infrastructure investment driving record ridership
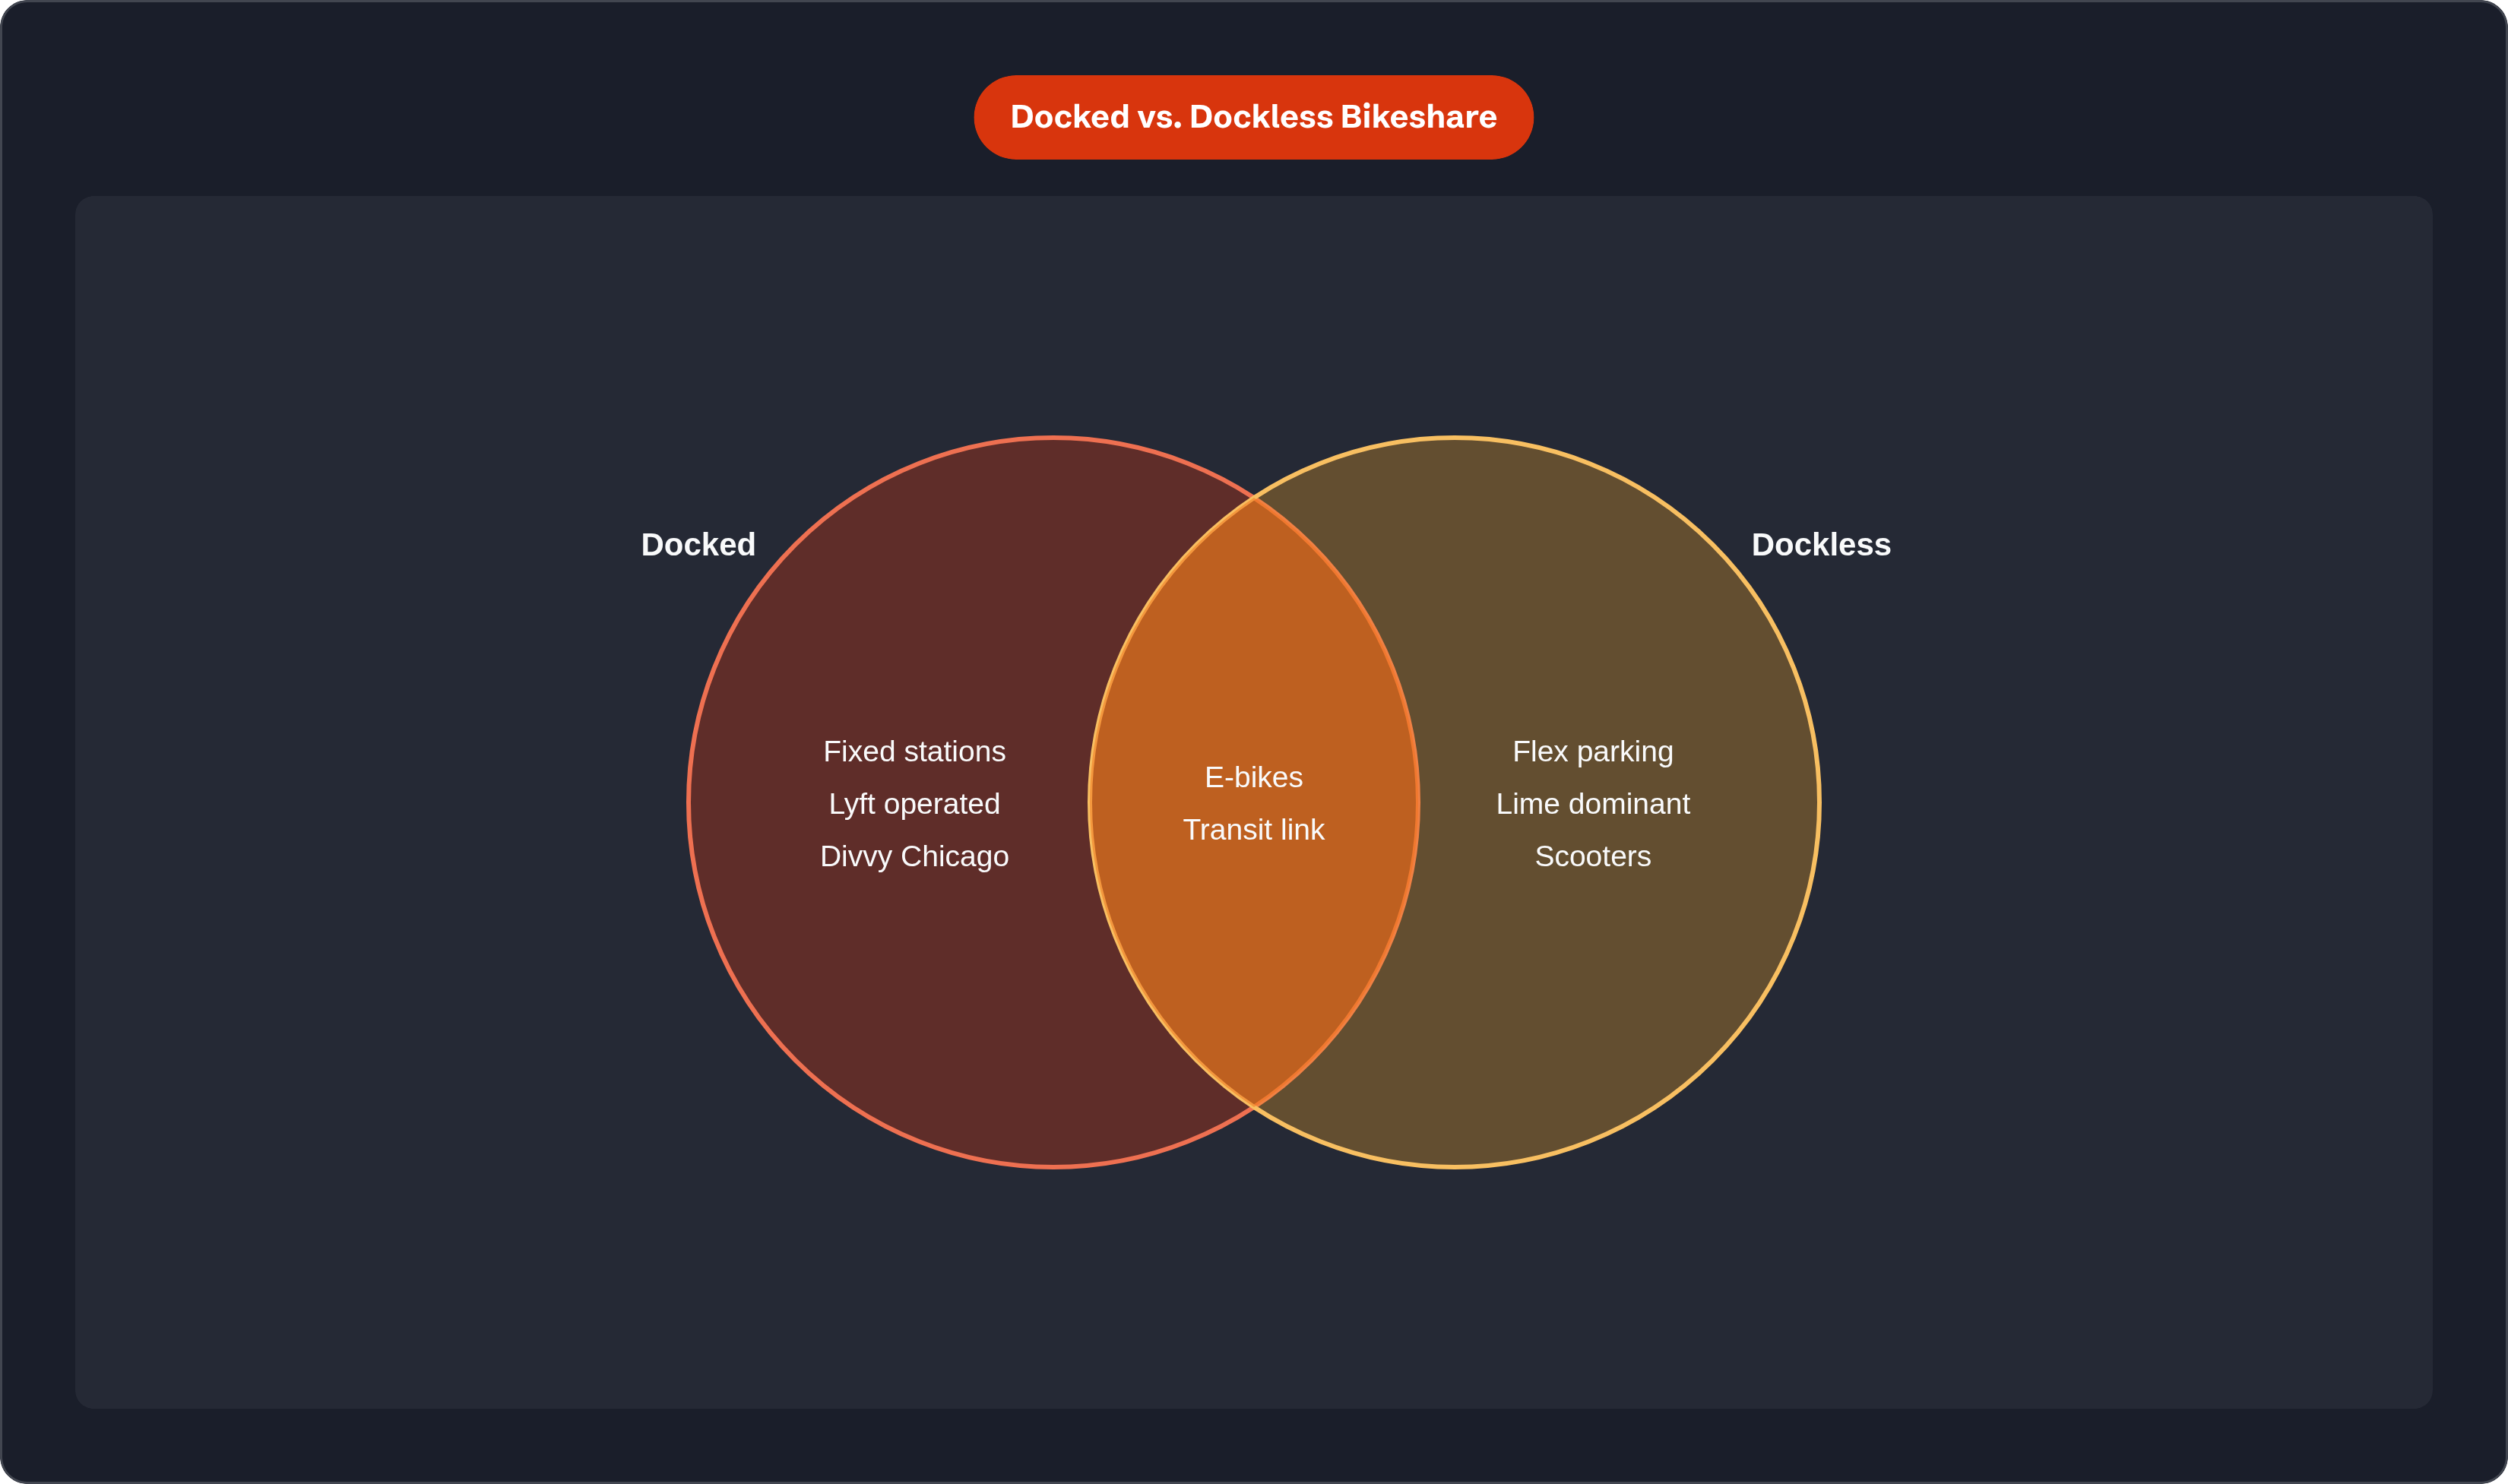
Chicago crossed 11 million combined shared bike and scooter trips in 2024, a new annual high. The city made two moves in parallel: hundreds of new Divvy stations and meaningful expansion of protected bike lane networks. Ridership responded not just to more bikes being available, but to streets becoming safer and more connected simultaneously — something neither intervention had achieved alone. Divvy, operated by Lyft, is one of the largest dock-based systems in the country outside New York, making Chicago a useful case study in the docked-versus-dockless tradeoff relative to markets like Seattle or D.C.
Seattle: a near-monopoly dockless market with strong growth
Seattle logged 6.3 million rides in 2024, up 28% over 2023. Lime accounted for nearly 5.9 million of those trips — more than 93% of all city rides through a single operator. Ridership was up 76% in Q1 2025 over Q1 2024, putting Seattle on track to exceed 10 million rides in 2025.
Seattle runs a dockless-only model with no competing dock system. That concentration raises a structural question: what happens to a city's micromobility access when its dominant operator fails? When Bird filed for bankruptcy in December 2023, cities that had built their last-mile strategy around Bird found every scooter gone overnight — no warning, no replacement. Seattle hasn't faced that scenario, but the dependency is real and requires deliberate planning to manage.
Portland, Denver, and Philadelphia
Portland: making it permanent
Portland launched a permanent e-scooter program in summer 2024 after years of pilots. Lime and Lyft's BIKETOWN now operate roughly 3,500 electric scooters across the full 145-square-mile city, with BIKETOWN deploying over 3,000 bikes across 45 square miles and more than 245 stations by year-end 2025. The shift from pilot to permanent program is the real story — cities are moving away from one-year experiments toward multi-year commitments as the data matures.
Denver: a new operator and a broader fleet
Denver's Bird and Lime contracts expired in spring 2026. Rather than renewing, the city chose a single new operator, Veo, on a three-year agreement covering up to 9,000 vehicles across five vehicle types. About 70% of that fleet will be seated vehicles — a deliberate design choice for older riders and people with certain disabilities, and a relatively rare one in this industry. Denver City Council also passed 2025 legislation requiring sidewalk-riding detection technology and designated parking zones.
Philadelphia: steady equity progress
Philadelphia's Indego bikeshare hit a record 1.3 million rides in 2024. Modest by New York or D.C. standards, but Indego has built out its equity programming and geographic reach consistently, and the record ridership reflects that.
How to access and pay for shared micromobility
The main operators across major US cities: Lime (scooters and e-bikes, present in most major markets), Lyft (operates Citi Bike in NYC, Divvy in Chicago, BIKETOWN in Portland), Veo (growing presence, now primary in Denver), and Spin/Bird (reduced presence following Bird's bankruptcy, but still operating in some markets).
Pricing structures include per-minute charges after an unlock fee, ride bundles, annual memberships, and day passes. Memberships consistently offer the lowest per-ride cost for regular riders — Citi Bike's $220 annual pass versus $4.99 unlock plus per-minute charges for casual users makes the math straightforward for anyone riding with regularity.
A few practical notes: 78% of North American systems offer payment alternatives to smartphones, including call or text-to-unlock options and cash kiosks. Docked systems require starting and ending at a physical station; dockless systems allow more flexible parking within operator-defined zones. Pricing and parking rules change frequently — the app is always more current than any written guide.
Equity: affordability and distribution
70% of US systems now include at least one equity requirement as of 2024. Nearly half offer adaptive vehicles, up from 31% in 2023. Common requirements include cash payment acceptance, equitable vehicle distribution across neighborhoods, adaptive vehicles, multilingual information, and discounted fares for low-income users. Discounted fares in equity programs average 76% below full price.
Cities differ sharply in how specific those requirements actually are. Some mandate vague "discounted rates" with no further definition; others require 30 minutes of free rides for anyone earning up to 200% of the federal poverty level. Both can check the same compliance box on paper. Citi Bike's income-qualified programs have seen a 42% ridership increase since 2022 — targeted subsidies, when real, get used.
The funding model is under pressure. 20% of agencies relied on state or federal grants in 2024 to cover operating costs. 47% of systems are publicly or nonprofit run, meaning equity outcomes depend directly on public funding decisions. That works when budgets are stable and breaks down when they aren't.
Safety: rules, enforcement, and unresolved tensions
By 2024, 28 states plus D.C. had passed laws governing e-scooters, covering age limits, speed caps, and helmet requirements. A 2024 report from the NYC Comptroller documented that pedestrian injuries involving e-bikes and e-scooters jumped sharply following statewide legalization in 2022 and remained elevated, with sidewalk parking creating additional hazards for pedestrians and people with disabilities.
Denver's 2025 ordinance requires operators to build in sidewalk-detection technology and designated parking zones, placing the compliance obligation on the operator rather than the rider. D.C.'s 2025 Micromobility Fire Safety Standards Act requires e-bike and scooter batteries to meet strict fire-safety specifications — battery fires in dense urban housing are a documented problem, and D.C. is treating it as one.
Mandatory helmet requirements remain genuinely contested. Major operators have jointly stated that mandatory helmet laws discourage use and lead to disproportionate enforcement in lower-income communities. Check local rules before riding — helmet requirements, speed limits, and legal parking areas vary and change without much public notice.
The environmental case and where it holds
In 2024, shared micromobility across North America offset approximately 101 million pounds of CO₂ by replacing car trips. About 35% of shared micromobility trips replace car trips, and 74% of riders use shared micromobility to connect to transit.
A 2024 peer-reviewed systematic review found that if micromobility replaces walking or cycling rather than driving, emissions increase rather than decrease. The environmental benefit depends entirely on what mode the trip is actually replacing. Deployment location matters more than deployment volume: scooters placed in car-dependent areas near transit nodes perform better on emissions than those in walkable neighborhoods where people would have walked anyway.
What shapes a city's micromobility mix
Three variables explain most of the variation between cities:
Existing transit infrastructure. Micromobility works best where it fills first/last-mile gaps. Cities with strong subway or bus networks create natural demand. Cities without them face harder questions about what micromobility can realistically accomplish.
Regulatory posture. Pilot versus permanent program, competitive versus exclusive permits, and the specificity of equity and safety requirements all shape outcomes and compound over time.
Operator market dynamics. A single dominant provider like Seattle versus a competitive multi-operator field like D.C. produces different outcomes for price, coverage, and resilience when something goes wrong.
66% of all North American micromobility trips in 2024 were taken on electric devices. Program design should treat electrification as the default — charging infrastructure and battery safety standards belong in operator agreements from the start. Bird's 2023 bankruptcy demonstrated how fast operator presence can evaporate; Denver's proactive 2026 operator transition is a useful model for treating these relationships as infrastructure decisions rather than loose service arrangements. The shift to permanent programs demands better contract design upfront — a three-year exclusive agreement is a fundamentally different commitment than a one-year pilot renewal.