Micromobility Equity Gaps in Low-Income Neighborhoods
Shared bikes and scooters boom in wealthy neighborhoods while low-income areas get left behind.
There's a story hiding inside the numbers, and it starts with a record-breaking year.
In 2024, riders took 225 million trips on shared bikes, e-bikes, and e-scooters across North America. That's a 31% jump over 2023, the second straight record year. There are now 415 cities with at least one shared system, 333,000 vehicles deployed, and a growing share of those trips happening on electric devices. By almost every headline metric, the industry is thriving — like a tree that looks lush from the road but whose roots only reach half the yard.
But here's the thing about headline metrics: they tell you how much is happening, not where. And the where is the whole story.
The equity gap in micromobility isn't new. Spatial equity in shared transportation has been documented as a problem for over a decade. What's new is that record ridership numbers make it harder to see from the outside. The industry looks like it's reaching everyone. It isn't.
Where Stations and Fleets Actually Land When Operators Choose Deployment Zones
Let's start with the most basic question: where do the vehicles go?
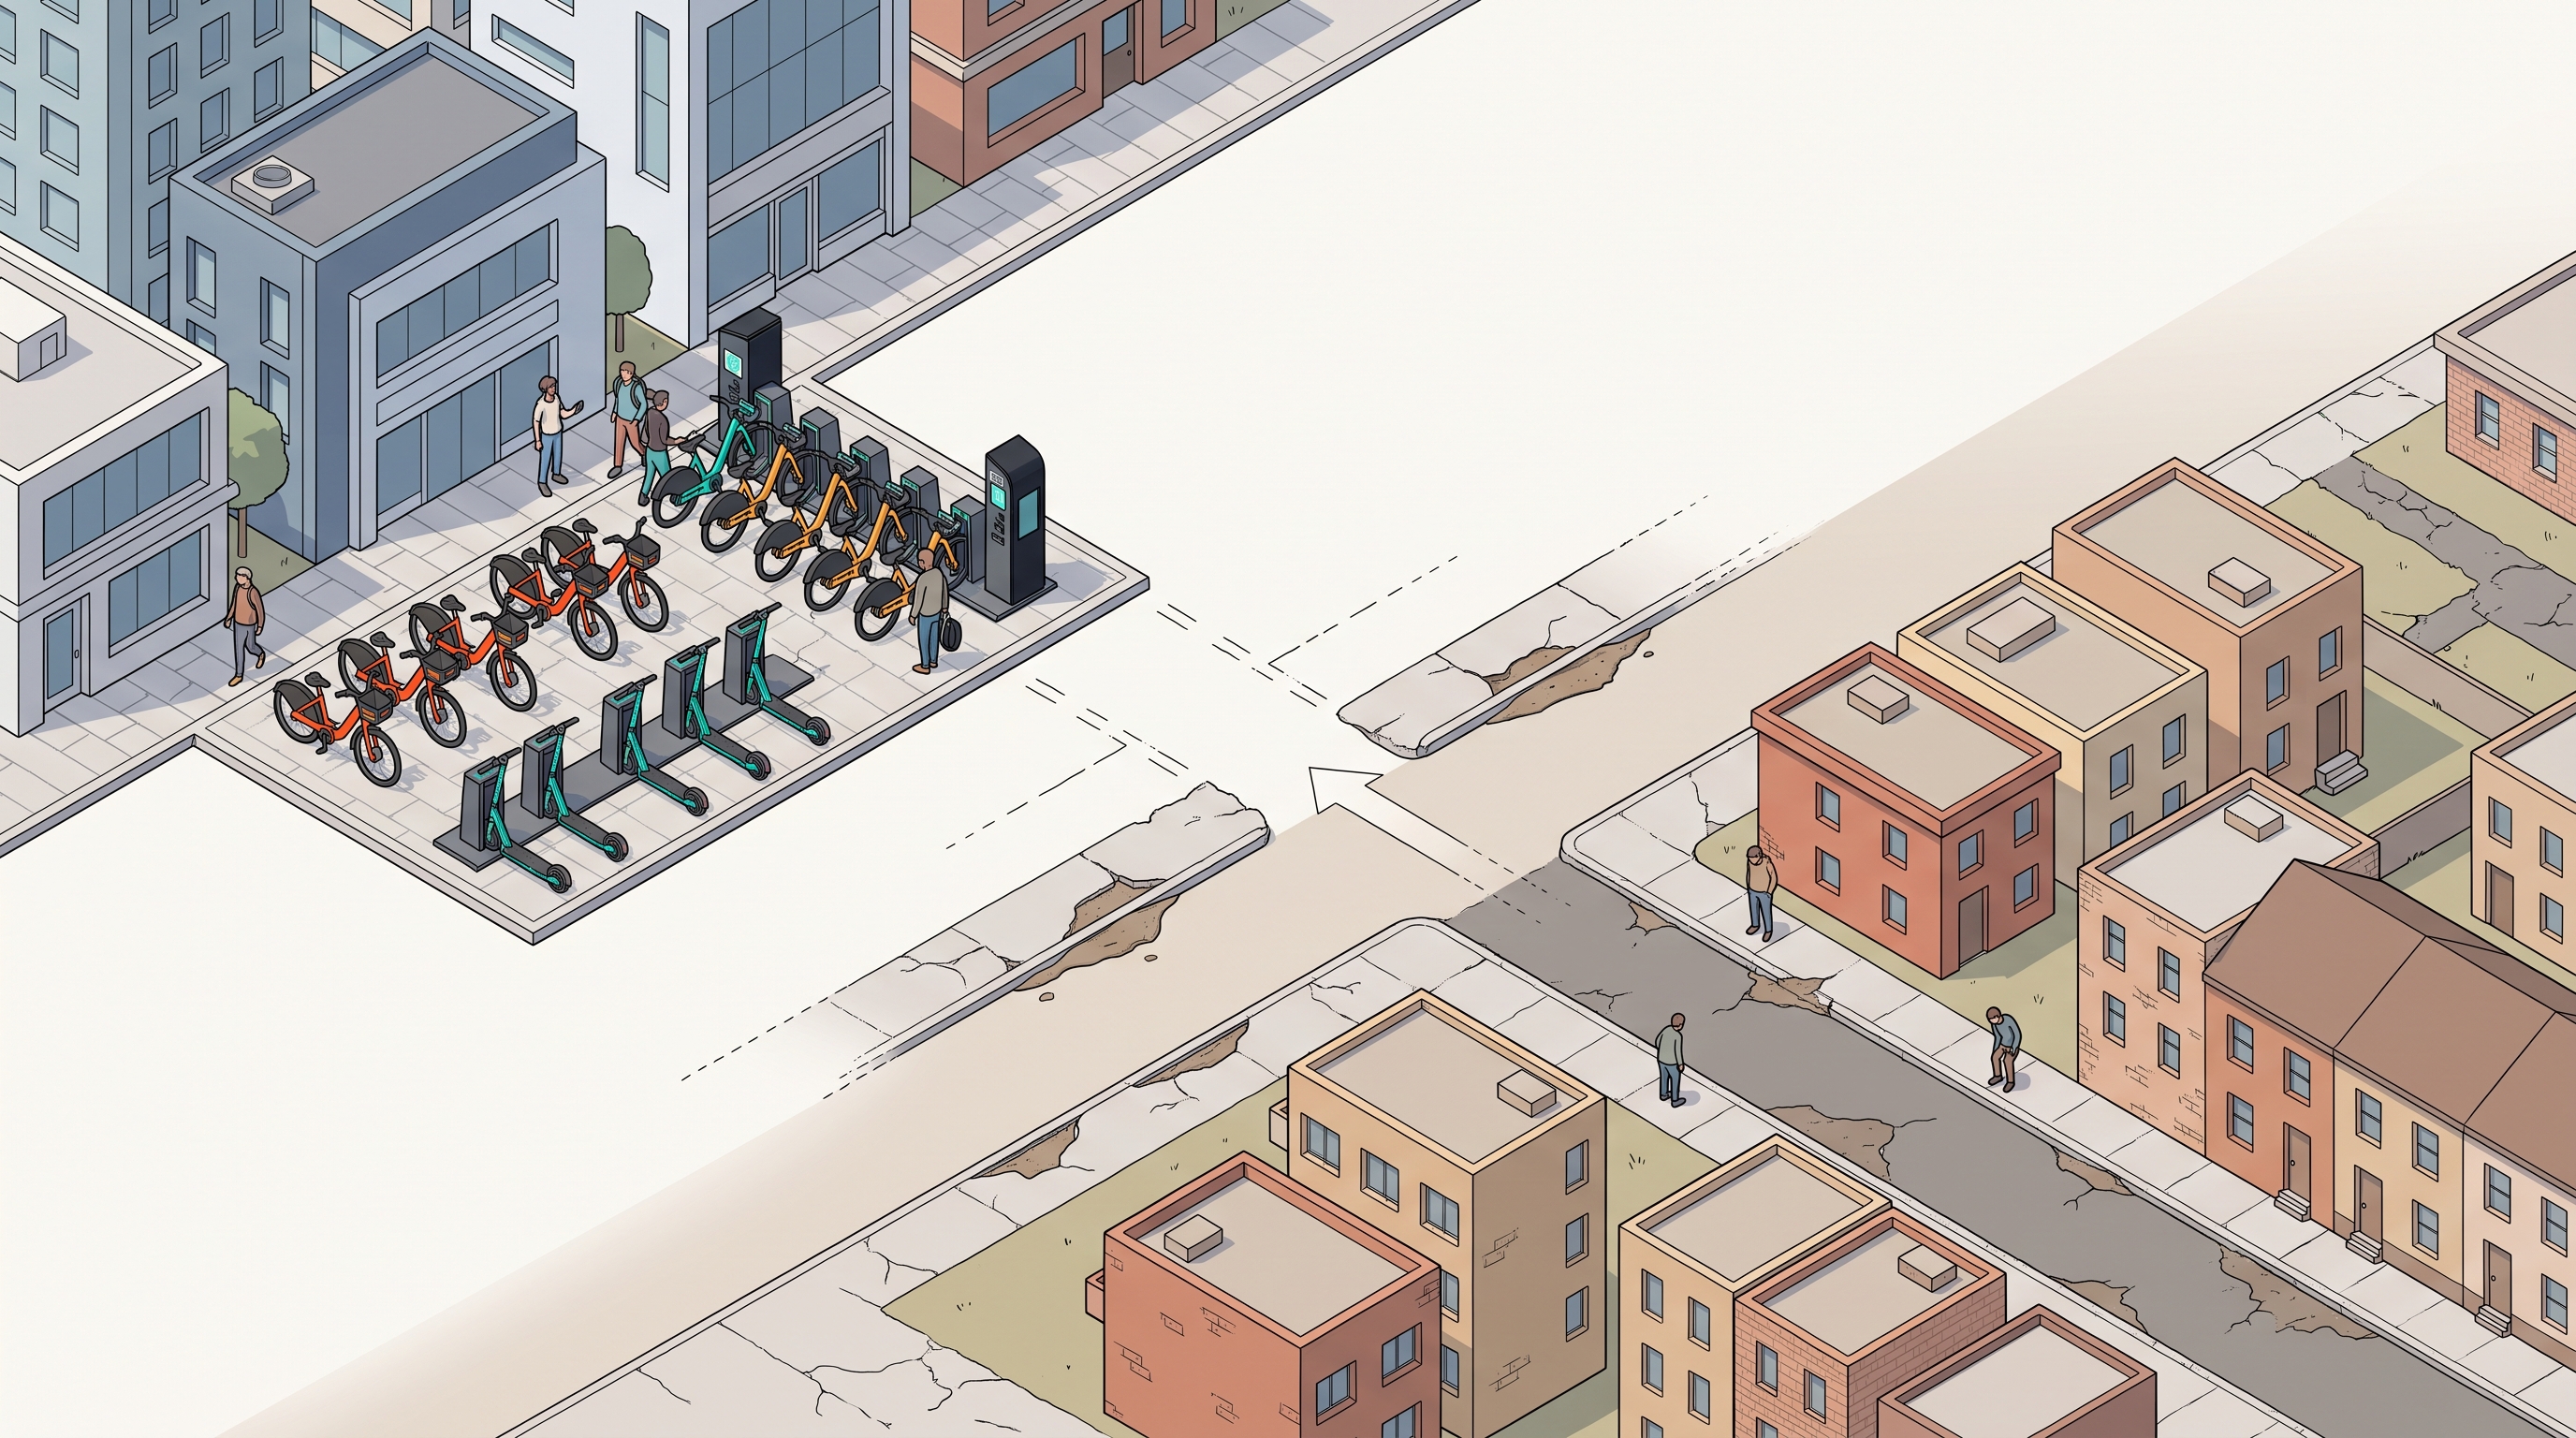
Research across multiple cities, tracked over more than a decade, has consistently found the same thing. Bikeshare stations cluster in economically active areas. Higher median incomes. More college graduates. Whiter demographics. A longitudinal study tracking five cities over ten years found that equity gaps in physical access have narrowed over time. But higher-income and white populations still have meaningfully better proximity to bike share than lower-income and minority communities do.
Seattle showed the same pattern. Greater vehicle availability in socioeconomically advantaged neighborhoods, even in a city that has actively tried to correct it.
This isn't mostly about bad intentions. It follows from how operators measure fleet performance. Vehicles only earn revenue when they're moving. A scooter sitting idle in a lower-demand area is, on paper, a loss. So fleets gravitate toward dense, central corridors where utilization rates and trip-per-vehicle-per-day metrics are high. That is a rational business decision. It is also a structural mechanism that disadvantages outer, lower-income neighborhoods every single time.
The incentive and the outcome are perfectly aligned. That's what makes it persistent.
What the Washington D.C. Data Reveals About Who Actually Takes Trips
Washington D.C. is one of the most useful cities to look at because it runs station-based bikeshare and dockless e-scooters at the same time. Two different vehicle types. Two different deployment models. Same city. This lets researchers compare them directly, and what they found is clarifying.
Black-majority block groups make up 45% of all block groups in D.C. They account for 6.2% of bikeshare trips and 5.4% of e-scooter trips — numbers that expose a last-mile connectivity gap that aggregate city-level data obscures.
Read that again.
New York City Citi Bike data shows the same directional finding: ridership increases with neighborhood income and decreases as the share of Black and Hispanic residents rises. Across the industry broadly, bikeshare users skew younger, educated, affluent, and white. This has been the finding in research after research.
The D.C. numbers matter because they rule out the easiest explanation. This isn't just about physical access. Even in neighborhoods where devices are technically available nearby, trip rates in Black-majority areas remain a fraction of what their population share would predict. Something else is going on.
Why Adding More E-Scooters to Underserved Neighborhoods Doesn't Close the Gap
Here's the part that should change how cities write policy. It hasn't yet, for most of them.
Dockless e-scooters reach more of D.C.'s geography than station-based bikeshare. They provide higher vehicle availability in some underserved areas. And yet, the research found that the accessibility gap between disadvantaged and advantaged neighborhoods is wider for e-scooters, not narrower.
The mechanism is this: when you put more scooters in a lower-income area, those scooters sit idle longer. Vehicles aren't moving because people don't need mobility. They're not moving because other barriers are preventing uptake. More supply without addressing those barriers produces longer idle time, not more trips, and idle vehicles are the trigger that sets fleet rebalancing in motion.
There's also a rebalancing issue. Operators regularly pull vehicles from areas where they're not being used and move them back to high-demand zones. Research found that racial minority-dominant neighborhoods experience more rapid fleet rebalancing, which shrinks the effective window during which a nearby vehicle is actually available to a nearby rider.
"Deploy more scooters" is the most politically convenient equity intervention. It's visible. It's easy to announce. The evidence says it doesn't work on its own. Why did the scooter go to the rich neighborhood? Because that's where it could make the most cents.
The Layered Barriers That Stop Low-Income Riders From Using Systems That Are Technically Nearby
Four distinct barrier types show up in the research.
- Physical. No station close enough, or vehicles rebalanced away before you get there.
- Financial. Per-ride pricing or membership costs that don't work on a tight budget.
- Logistical. No bank account, no credit card, no smartphone, no data plan. Virtually every shared mobility app requires at least one of these.
- Technological. Limited familiarity with the apps themselves.
In Chicago, research found that many low-income households lack access to mainstream banking or credit, a population commonly referred to as unbanked or underbanked. That's not a fringe situation. That's a prerequisite barrier. If your city's equity program requires a smartphone app and a credit card to sign up for the discount plan, you've already filtered out the people you're trying to reach.
Safety adds another layer specific to minority communities. Fear of traffic collisions. Fear of robbery or assault while riding. Poor pavement conditions that make riding genuinely dangerous. Fear of police profiling. These aren't hypothetical concerns.
And then there's something subtler. Research shows that the visible absence of Black bikeshare users reinforces the perception that the service isn't for them. If you've never seen anyone who looks like you using something, the idea that you should try it doesn't arrive naturally, even if you're technically eligible for a discount program.
The barriers compound. A rider who can afford a discounted membership is still blocked by not having a smartphone. Or deterred by unsafe pavement. Or quietly discouraged by never seeing people like them in the ads, on the streets, or in the data. Each barrier is a filter. Taken together, they're a wall.
Women, older adults, people with disabilities, and transit-dependent riders face overlapping versions of these same barriers.
Where the Low-Income Rider Actually Shows Up When Given Real Access
Here's the encouraging part, and it's important.
A 2024 survey of hundreds of Lime customers across the U.S., Australia, and New Zealand is one of the first studies to directly compare how low-income riders use micromobility versus general riders. The finding is intuitive once you see it: low-income riders use subsidized programs more frequently when those programs actually exist. Uptake follows access, not awareness campaigns.
There's also preliminary evidence that e-scooters appeal to racially diverse and lower-income populations more than traditional bike share does. That's a real asset. Current deployment patterns aren't exploiting it.
Across the full industry, 74% of riders report using shared micromobility to connect to transit, per the NABSA 2025 data. For a low-income rider without a car, that last-mile function isn't a convenience. It's the whole point. New research confirms that low-income riders are increasingly using micromobility to support car-free lifestyles and make transit connections. That's a different use case than the affluent recreational commuter model that most operators are implicitly designing for.
The low-income rider shows up when the system works for them. The system currently isn't designed for them.
The Spatial Overlap Between Food Deserts and Micromobility Dead Zones
About 39 million Americans live in low-income, low-access areas — and for many of them, a working e-scooter would do more for their week than any headline statistic. That means more than a mile from a supermarket in urban settings, or more than ten miles in rural ones. That's roughly 13% of the U.S. population, per USDA data from 2022. A substantial subset of those households have no car and no nearby grocery store.
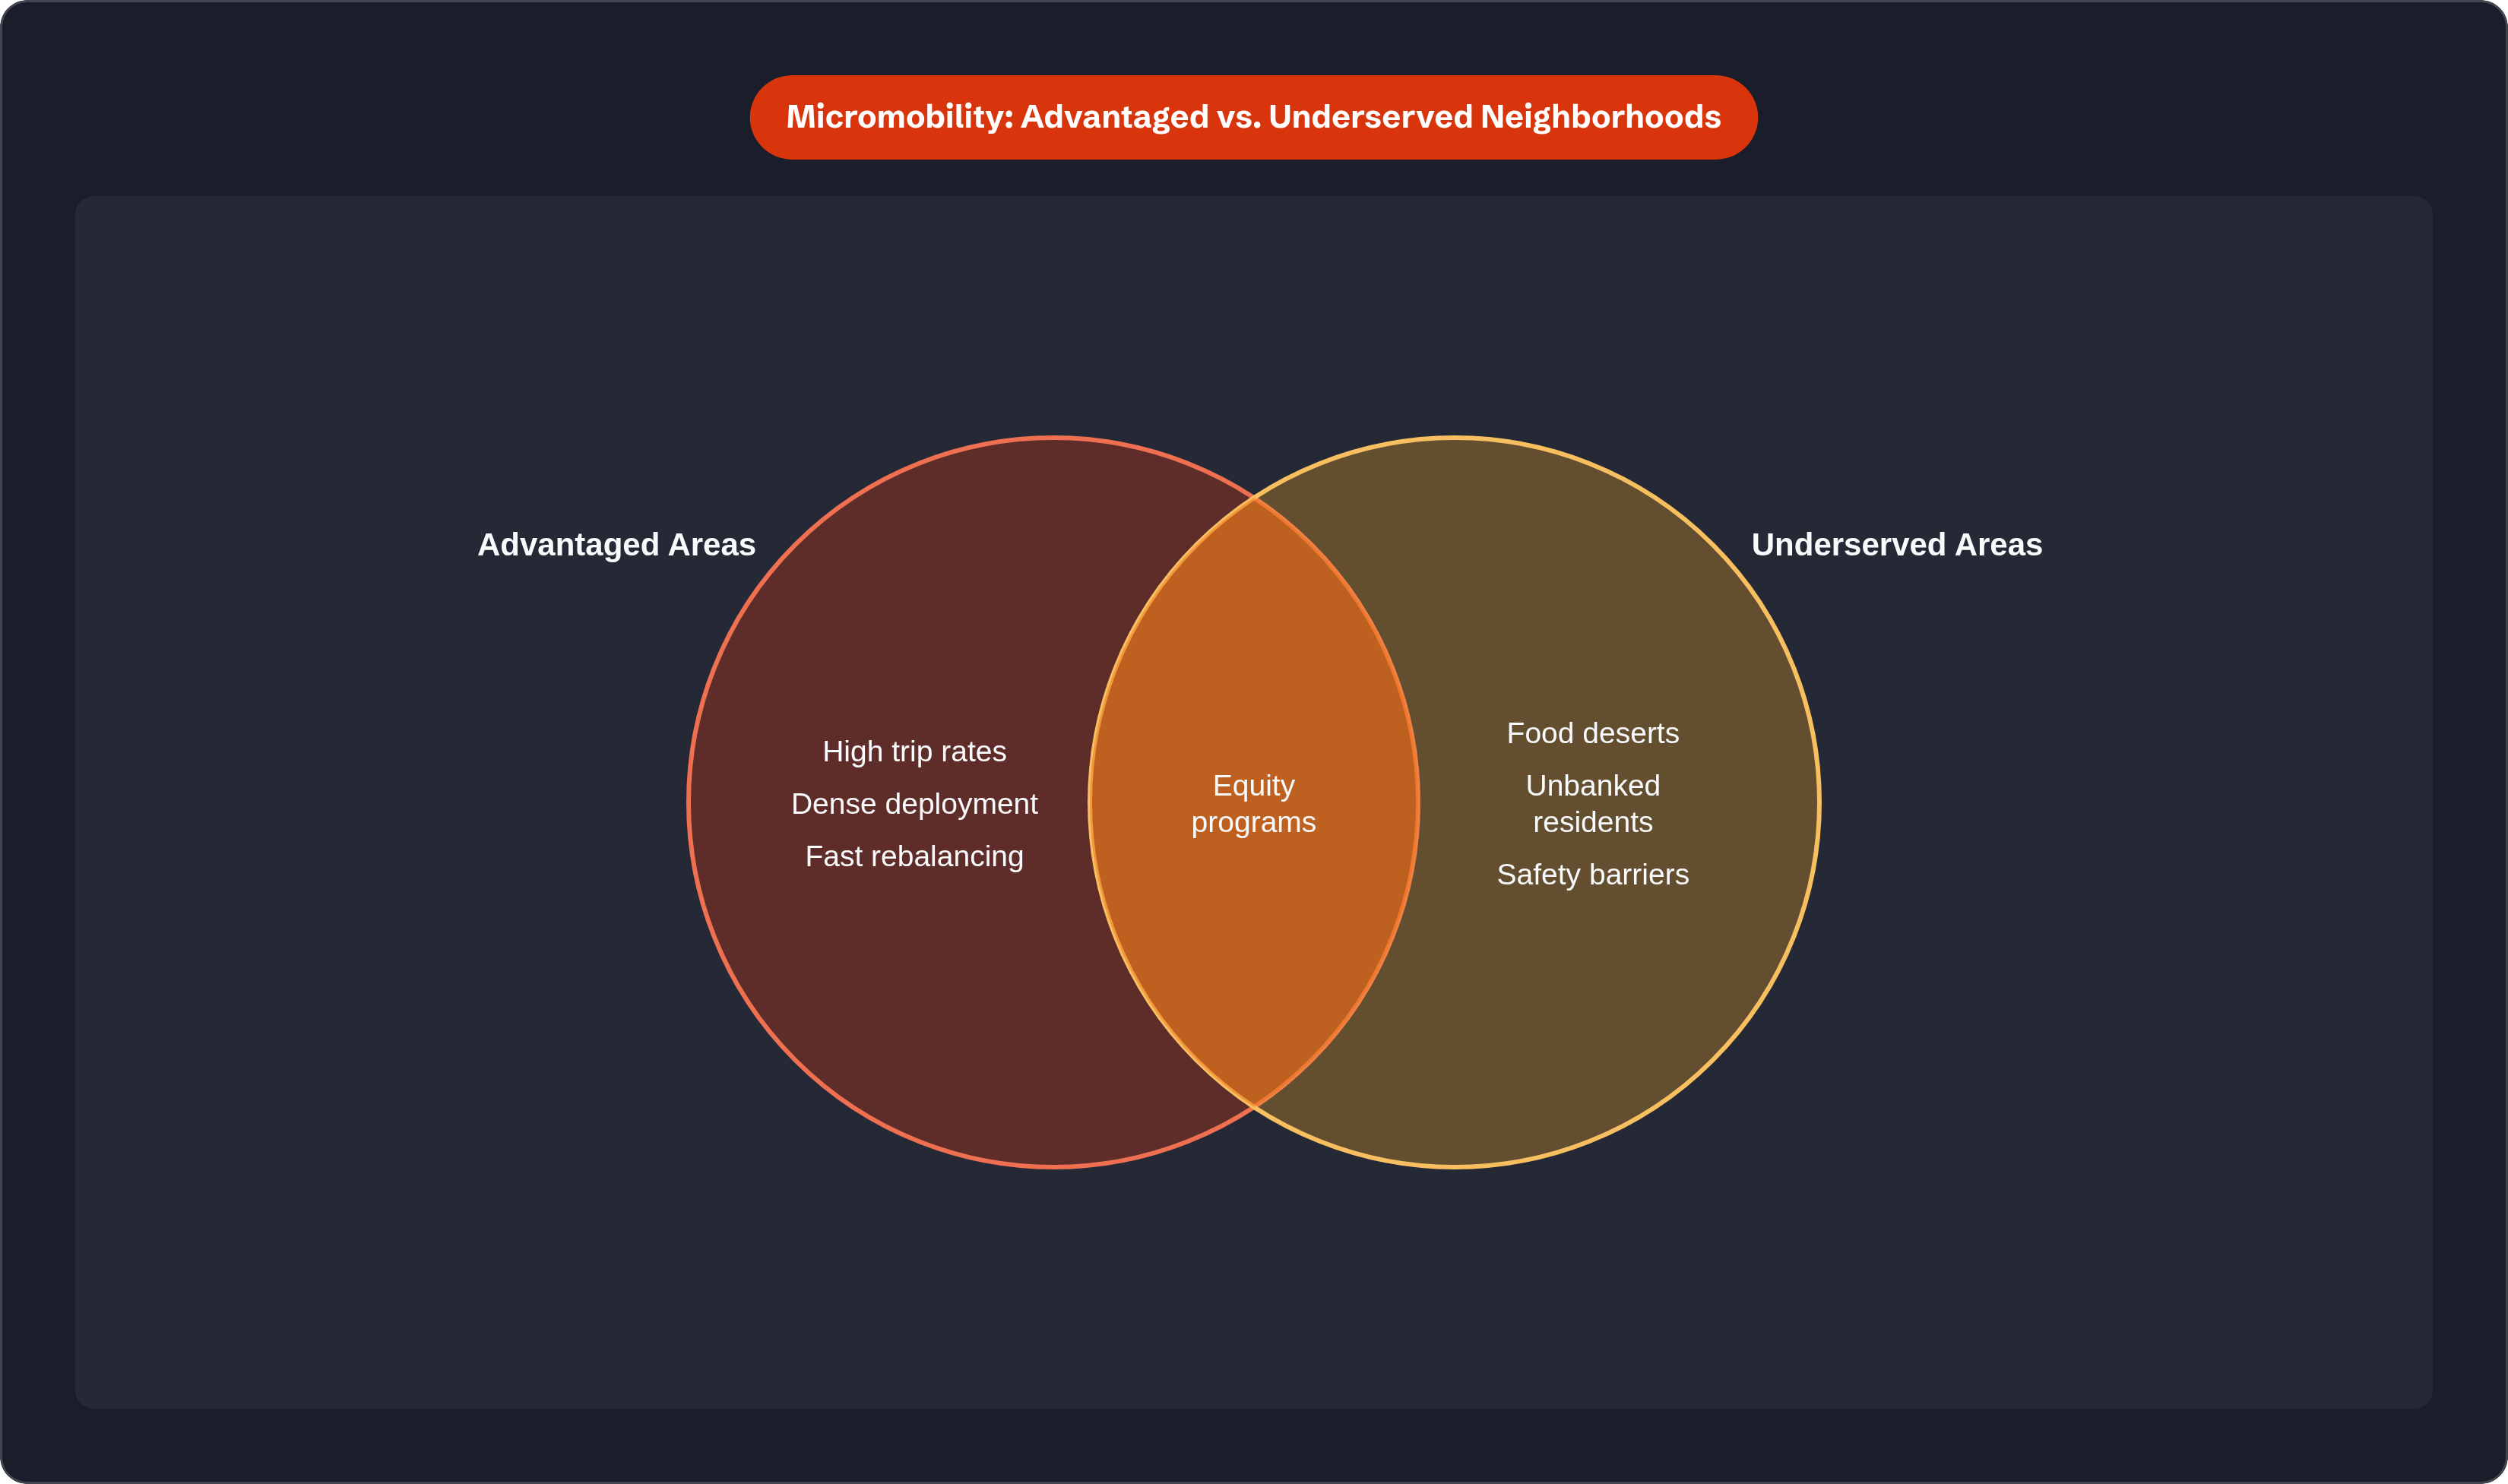
The geographic overlap between food deserts and micromobility-underserved areas hasn't been formally mapped at scale. But the neighborhood characteristics that discourage operator deployment (lower density, lower expected usage, lower income) are the same ones that correlate with limited grocery access. The Venn diagram has a lot of overlap, even without a study confirming the exact shape of it.
For a resident of such a neighborhood, a reliable e-scooter or e-bike isn't a lifestyle upgrade. It's a potential substitute for a car trip they can't take because they don't have a car, which is exactly the transportation-insecure population dockless systems were supposed to reach. The mobility gap isn't abstract. It shows up in how long it takes to carry groceries home, or whether you can get to a job with odd hours, or whether the transit connection you need is actually reachable.
Aggregate ridership statistics don't capture any of that. The cost of the gap is paid in daily logistics by specific people in specific places.
What Equity Requirements Cities Are Writing Into Operator Permits, and What Those Requirements Actually Accomplish
Cities have been trying to address this. As of 2022, about 62% of U.S. shared micromobility services included at least one equity component. The requirements vary widely.
- Cash payment options
- Discounted rides and memberships
- Geographic distribution mandates
- Multilingual access
- Text-to-unlock as a smartphone alternative
- Adaptive vehicle offerings
Adaptive vehicle availability rose from 31% of systems in 2023 to nearly half in 2024. That's real, incremental progress.
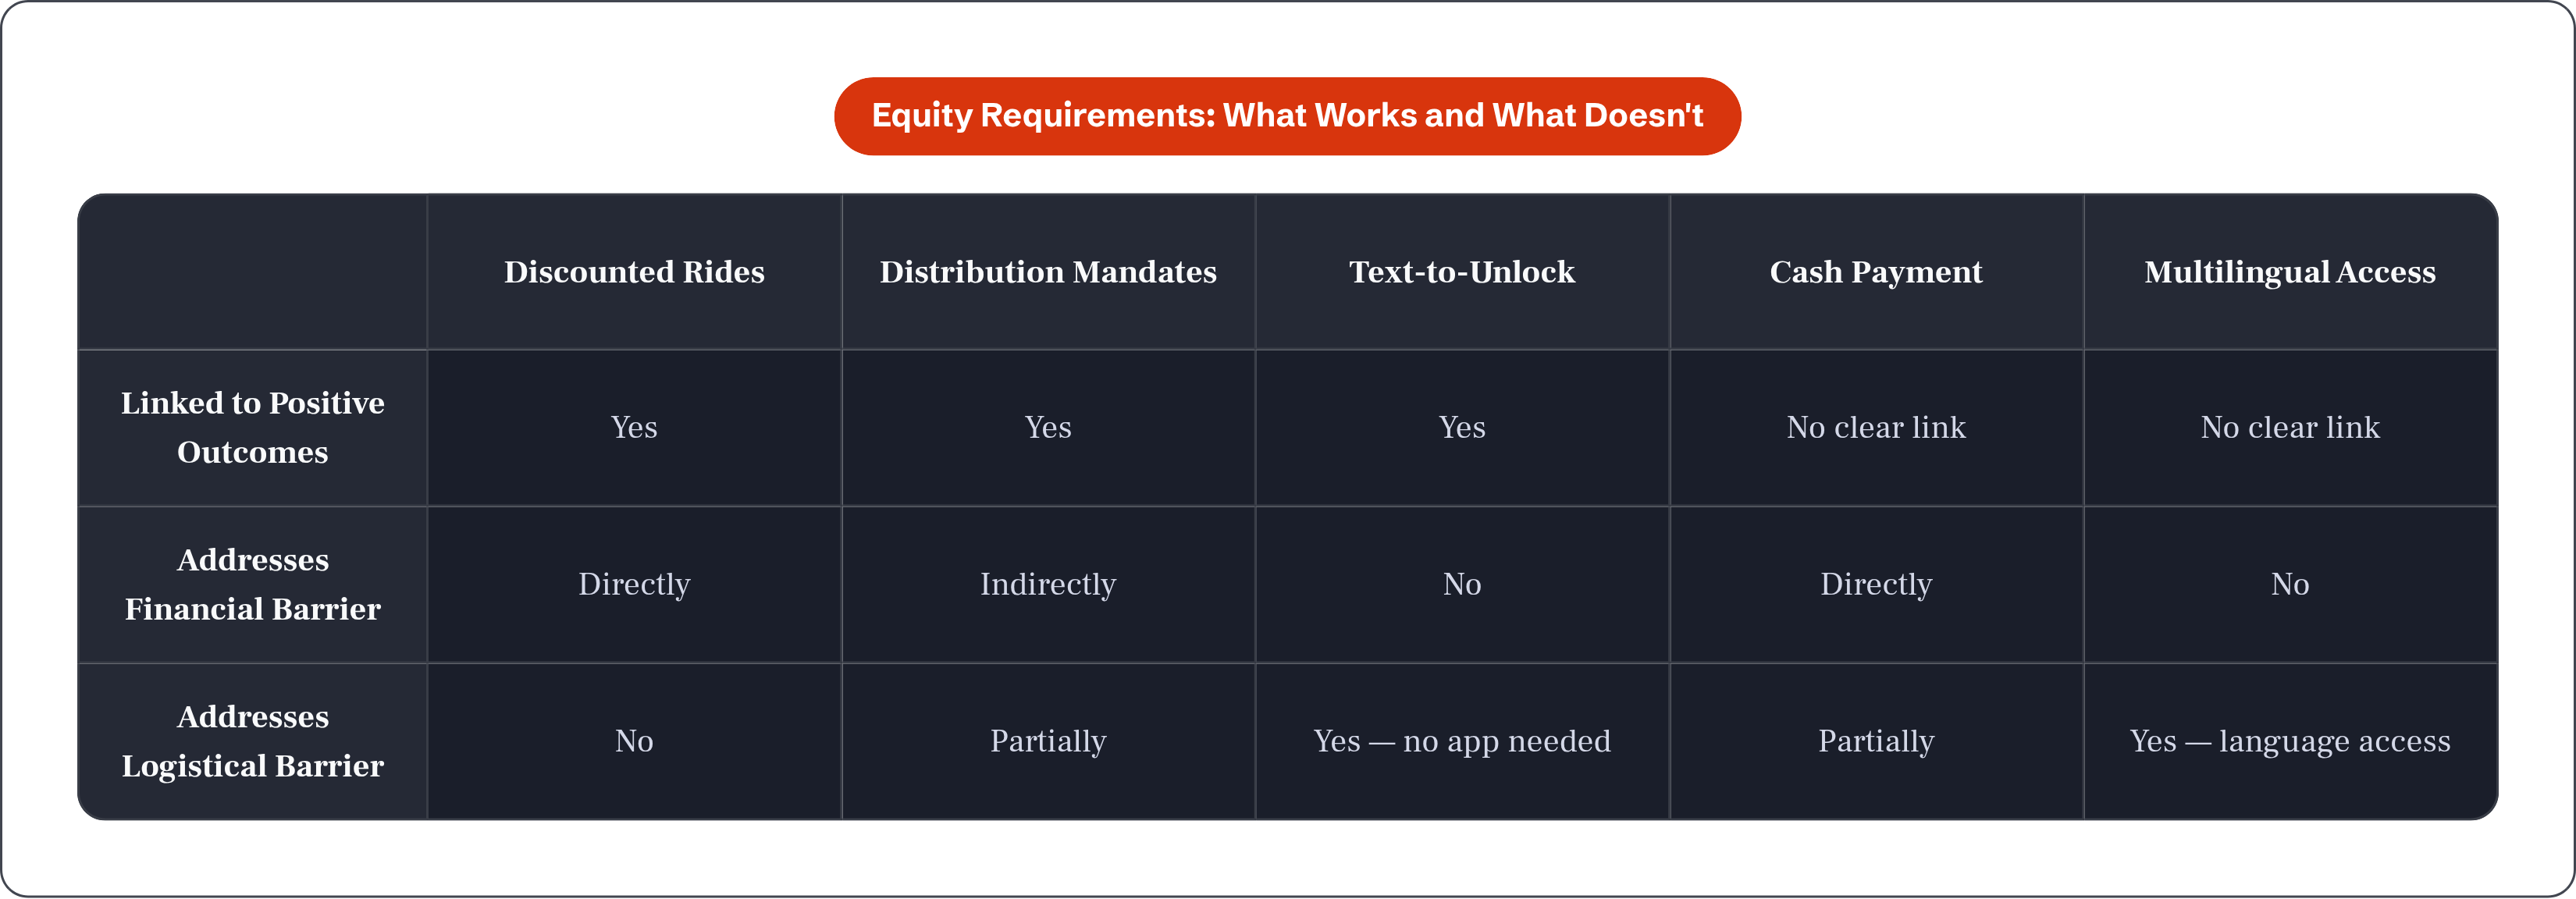
But a 2025 study using Bird and Lime data found that not all equity requirements produce the same outcomes. Discounted rides, distribution requirements, and text-to-unlock were associated with positive results. Cash payment and multilingual access requirements showed no clear link to measurable outcomes.
Washington D.C.'s DDOT has required since 2020 that dockless operators offer free unlimited 30-minute rides to qualified low-income riders. Sign-ups for those plans remain small. The program exists. The gap between a program existing and a rider actually using it is itself a barrier.
D.C.'s bikeshare equity program effectively increases low-income use. Its e-scooter equity programs don't show the same effect. Vehicle type and program design interact in ways most cities haven't fully figured out yet.
And here's a sharp irony embedded in the data: 54% of subsidized "Access" riders in one study reported frustration with not being able to find a vehicle when needed. Cities are funding discount programs while operators maintain fleet caps and rebalancing practices that remove vehicles from the same areas those programs are meant to serve.
Why the Industry's Consolidation Makes the Equity Problem Harder to Fix Going Forward
Bird filed for bankruptcy in December 2023. The industry has consolidated around fewer, larger operators. Less competition means less pressure to differentiate on equity commitments. There's no rival nipping at your heels for the underserved-neighborhood contract.
Cities are also moving from short pilot programs to multi-year or permanent arrangements. Fewer contract renewals mean fewer moments to renegotiate terms, add requirements, or adjust what isn't working based on actual outcome data.
Los Angeles has started requiring permit applicants to partner with local community organizations, embedding community accountability directly into permit conditions. That's a more substantive model than a checkbox distribution mandate. It builds in accountability and local knowledge. It's worth watching.
The evidence base on what actually works is only now becoming strong enough to write into policy. Specific discount structures. Rebalancing requirements tied to low-income zones. Community engagement as a permit condition. Outcome measurement from the start, not as an afterthought. That research is here. The policy window to act on it is narrowing as contracts lock in and the field consolidates.
The path forward isn't more equity checkboxes. It's designing requirements around the specific, compounding, documented barriers that research has actually identified. Logistical barriers. Financial barriers. Safety barriers. Infrastructure barriers. The barriers that don't show up in ridership dashboards, but show up every day for the people on the other side of the gap.