Urban Digital Twin Platforms for City Planning
Cities are testing live digital replicas to simulate infrastructure changes before spending money.
A digital twin of a city is a live, constantly updating replica of its roads, pipes, power grid, and buildings that planners can run "what-if" scenarios against before spending a single dollar of public money. That's the whole pitch, and unlike a lot of city-tech buzzwords, this one has receipts: real deployments, real budgets, and at least one very public cancellation that offers real lessons.
The data architecture underneath a city digital twin
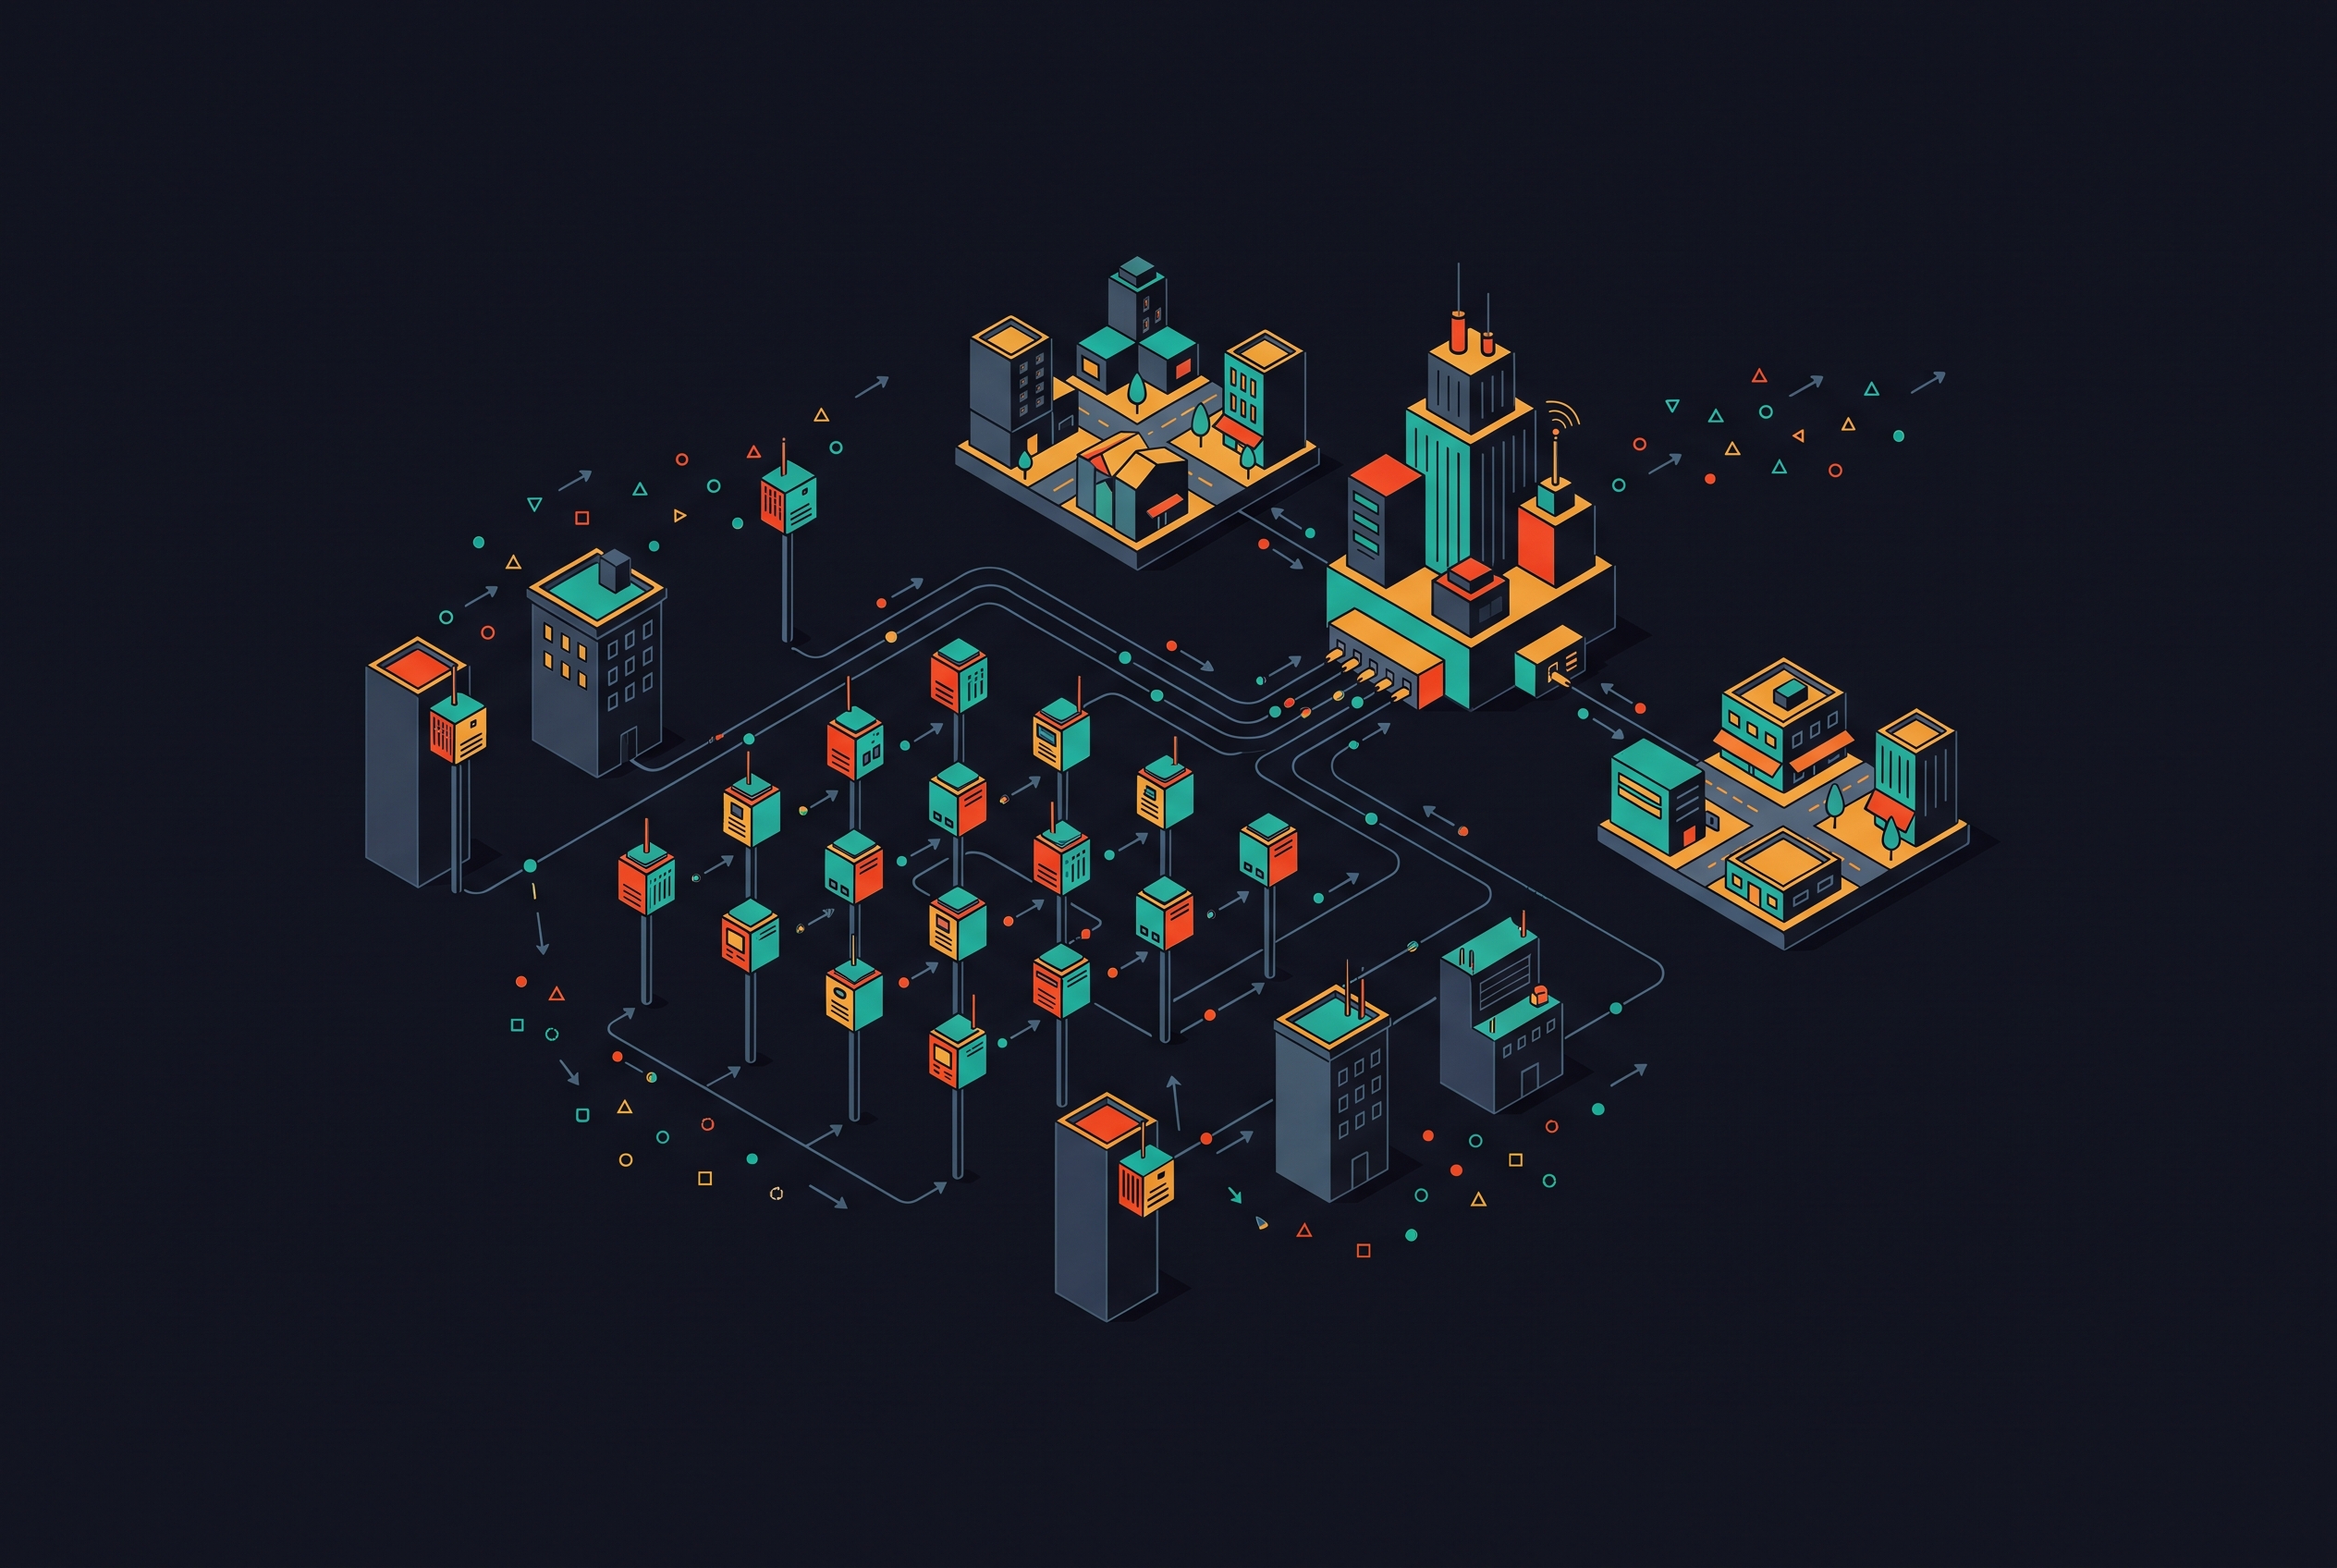
Start with what's actually feeding the thing. Thousands of sensors report in continuously: GPS pings off public buses, air quality monitors, smart meters logging every kilowatt a building burns. All of it lands in a central data lake, which is a fancier way of saying "one big bucket everything pours into instead of forty small buckets nobody talks to each other."
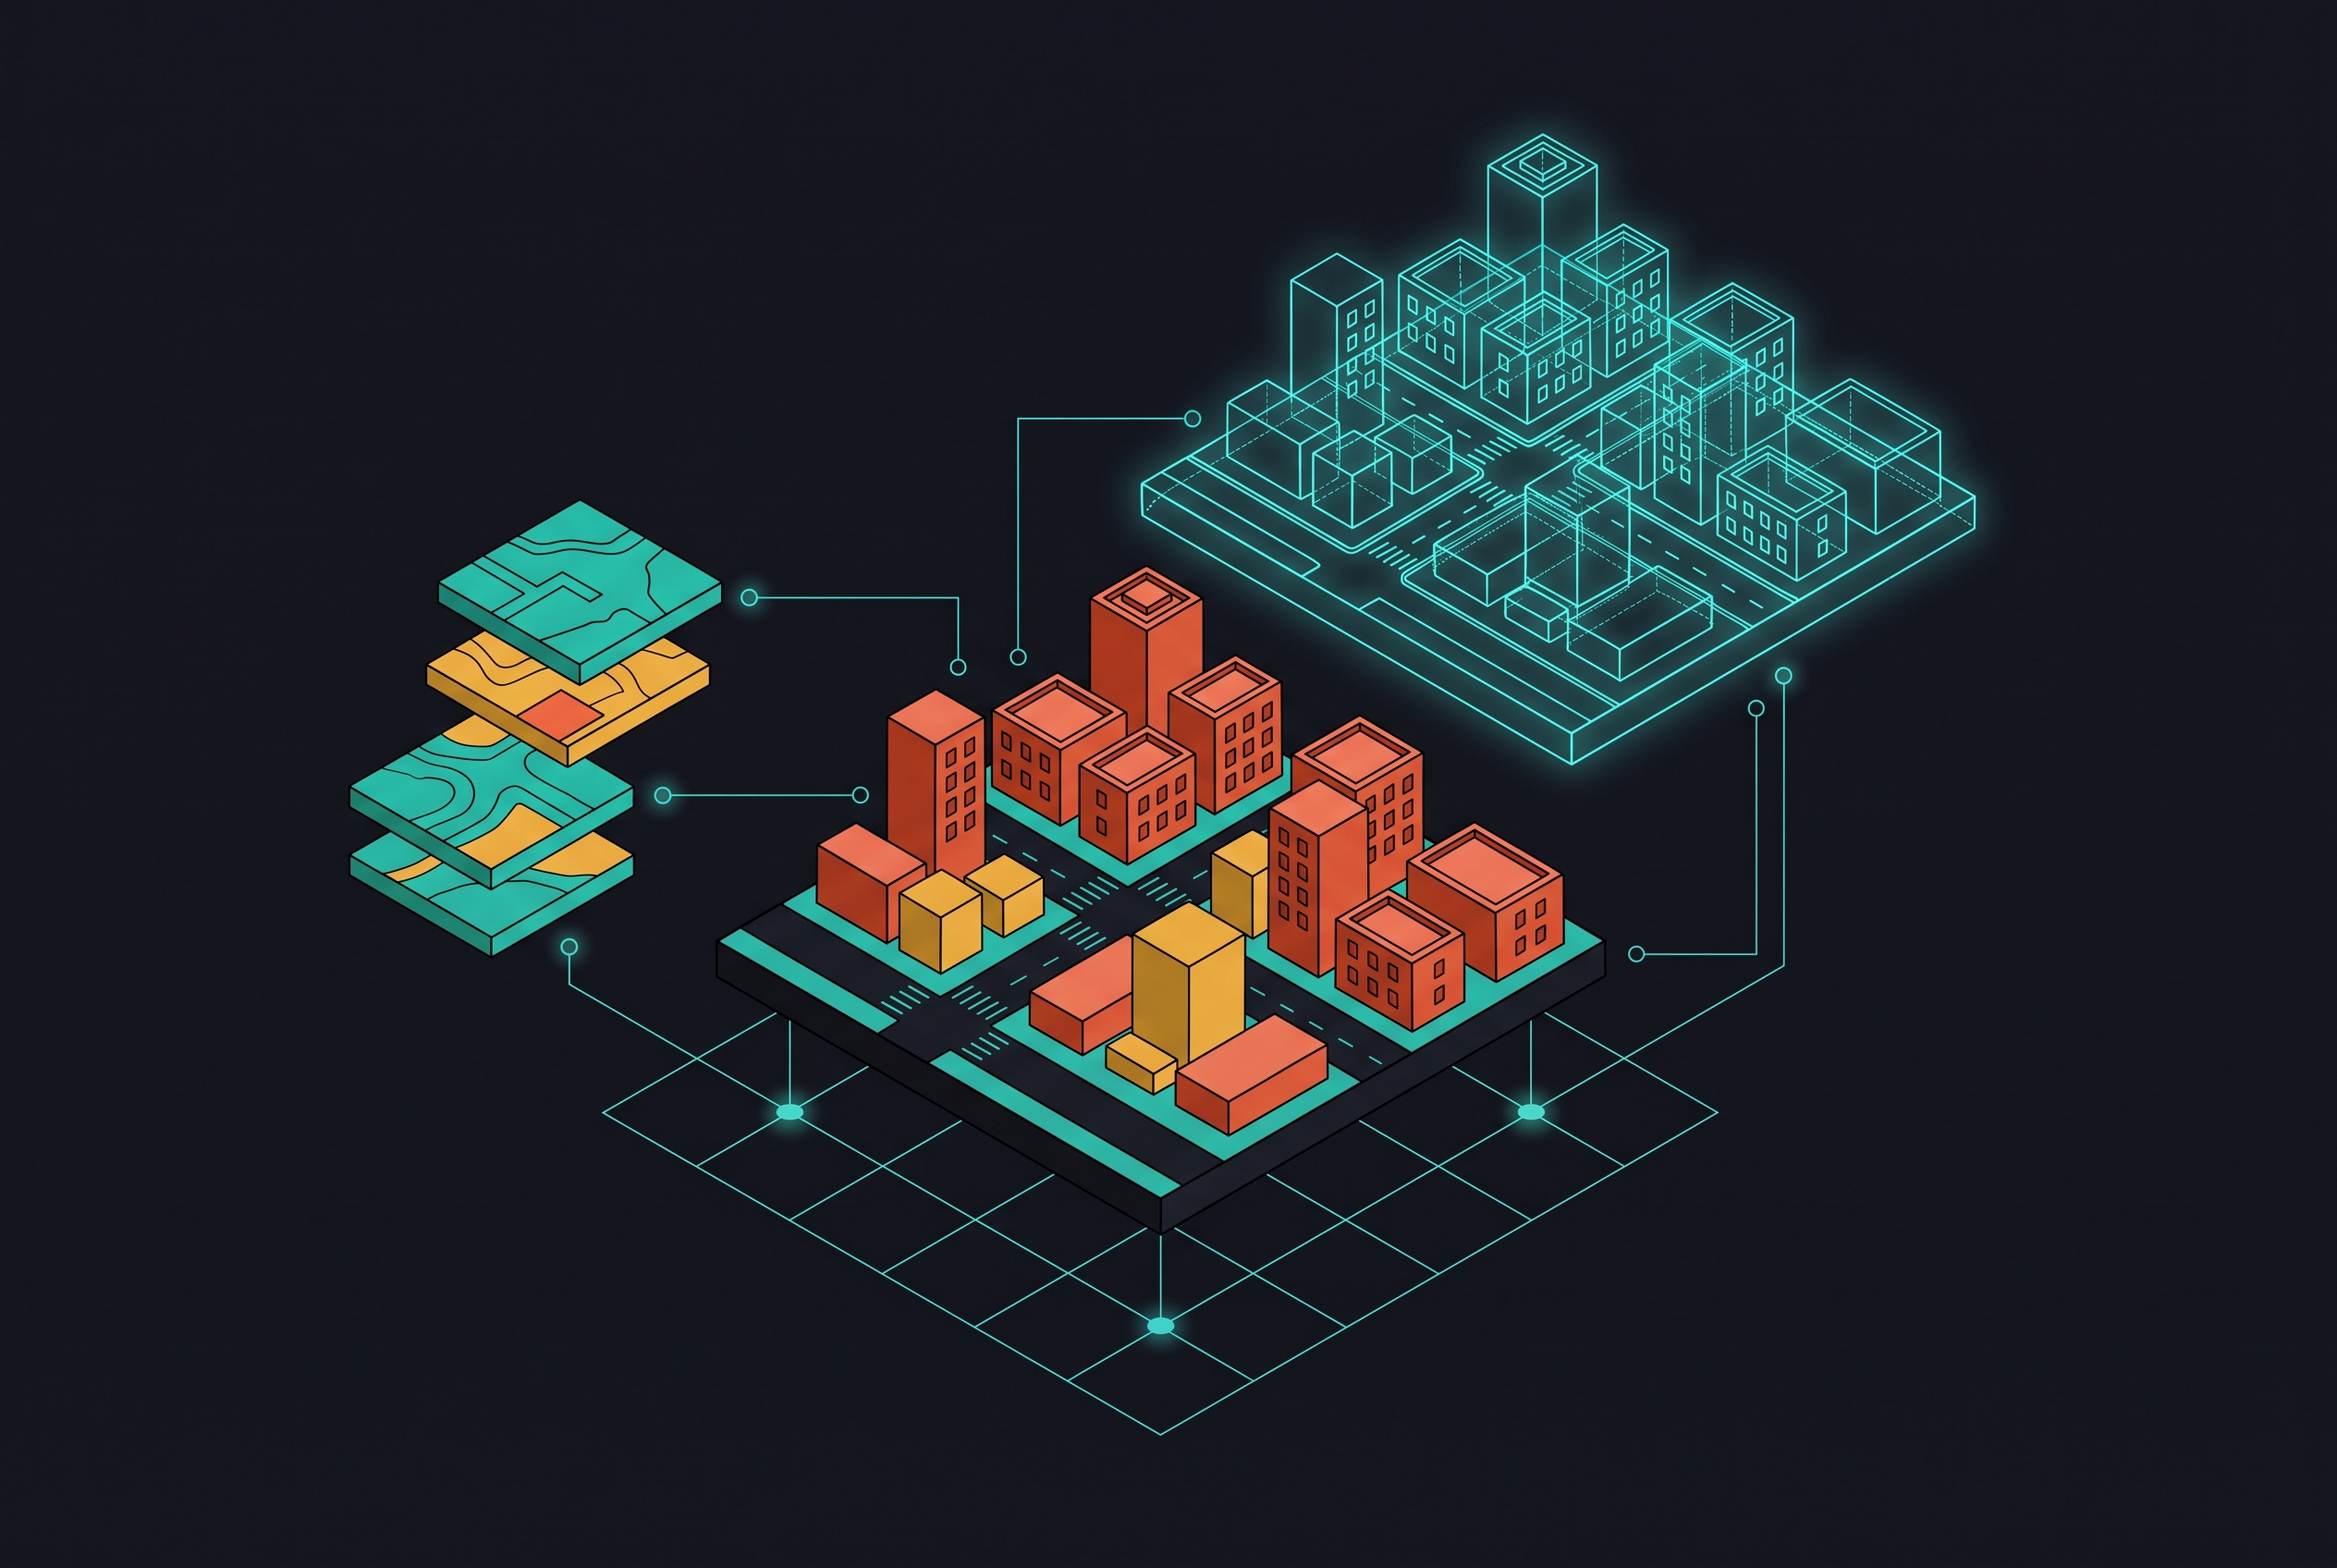
On top of that sits the 3D layer. GIS maps, LiDAR scans, and BIM files build the skeleton, the geometric shape of the city. Sensor data gives that skeleton a pulse. Then a simulation engine runs the scenarios, using machine learning to answer questions like "what happens to traffic if this metro line opens" or "how does this zoning change affect stormwater runoff", producing answers in minutes instead of the months a traditional study would take.
Volume isn't what matters, variety is. A traffic-only model has no idea that a broken water main is about to close three roads, reroute two bus lines, and delay every delivery truck downtown. The value appears when data sources talk to each other instead of sitting in silos, sulking.
That interconnection creates its own headaches, though. Technical ones (old CCTV systems don't exactly shake hands with a new cloud platform), organizational ones (who owns the utility data, who gets to see it), and the ongoing one where the system has to stay accurate as the city itself keeps changing underneath it. Cybersecurity has to be baked into the design from day one too, since a platform holding this much infrastructure and population data is a tempting target, not an afterthought bolted on later.
The good news: cities don't need a mountain of 3D data to get moving. Platforms like Esri's ArcGIS Urban can stand up a working digital twin using pre-built buildings and trees, running directly off existing GIS data for zoning and land-use work. No excuse to wait around for perfect data.
What planners can do with the platform once it is running
Once it's live, the platform earns its keep in a few concrete ways. Planners can simulate a new metro line's traffic effects, test a rezoning's impact on stormwater, or model how a heat wave stresses the power grid, all before anyone breaks ground.
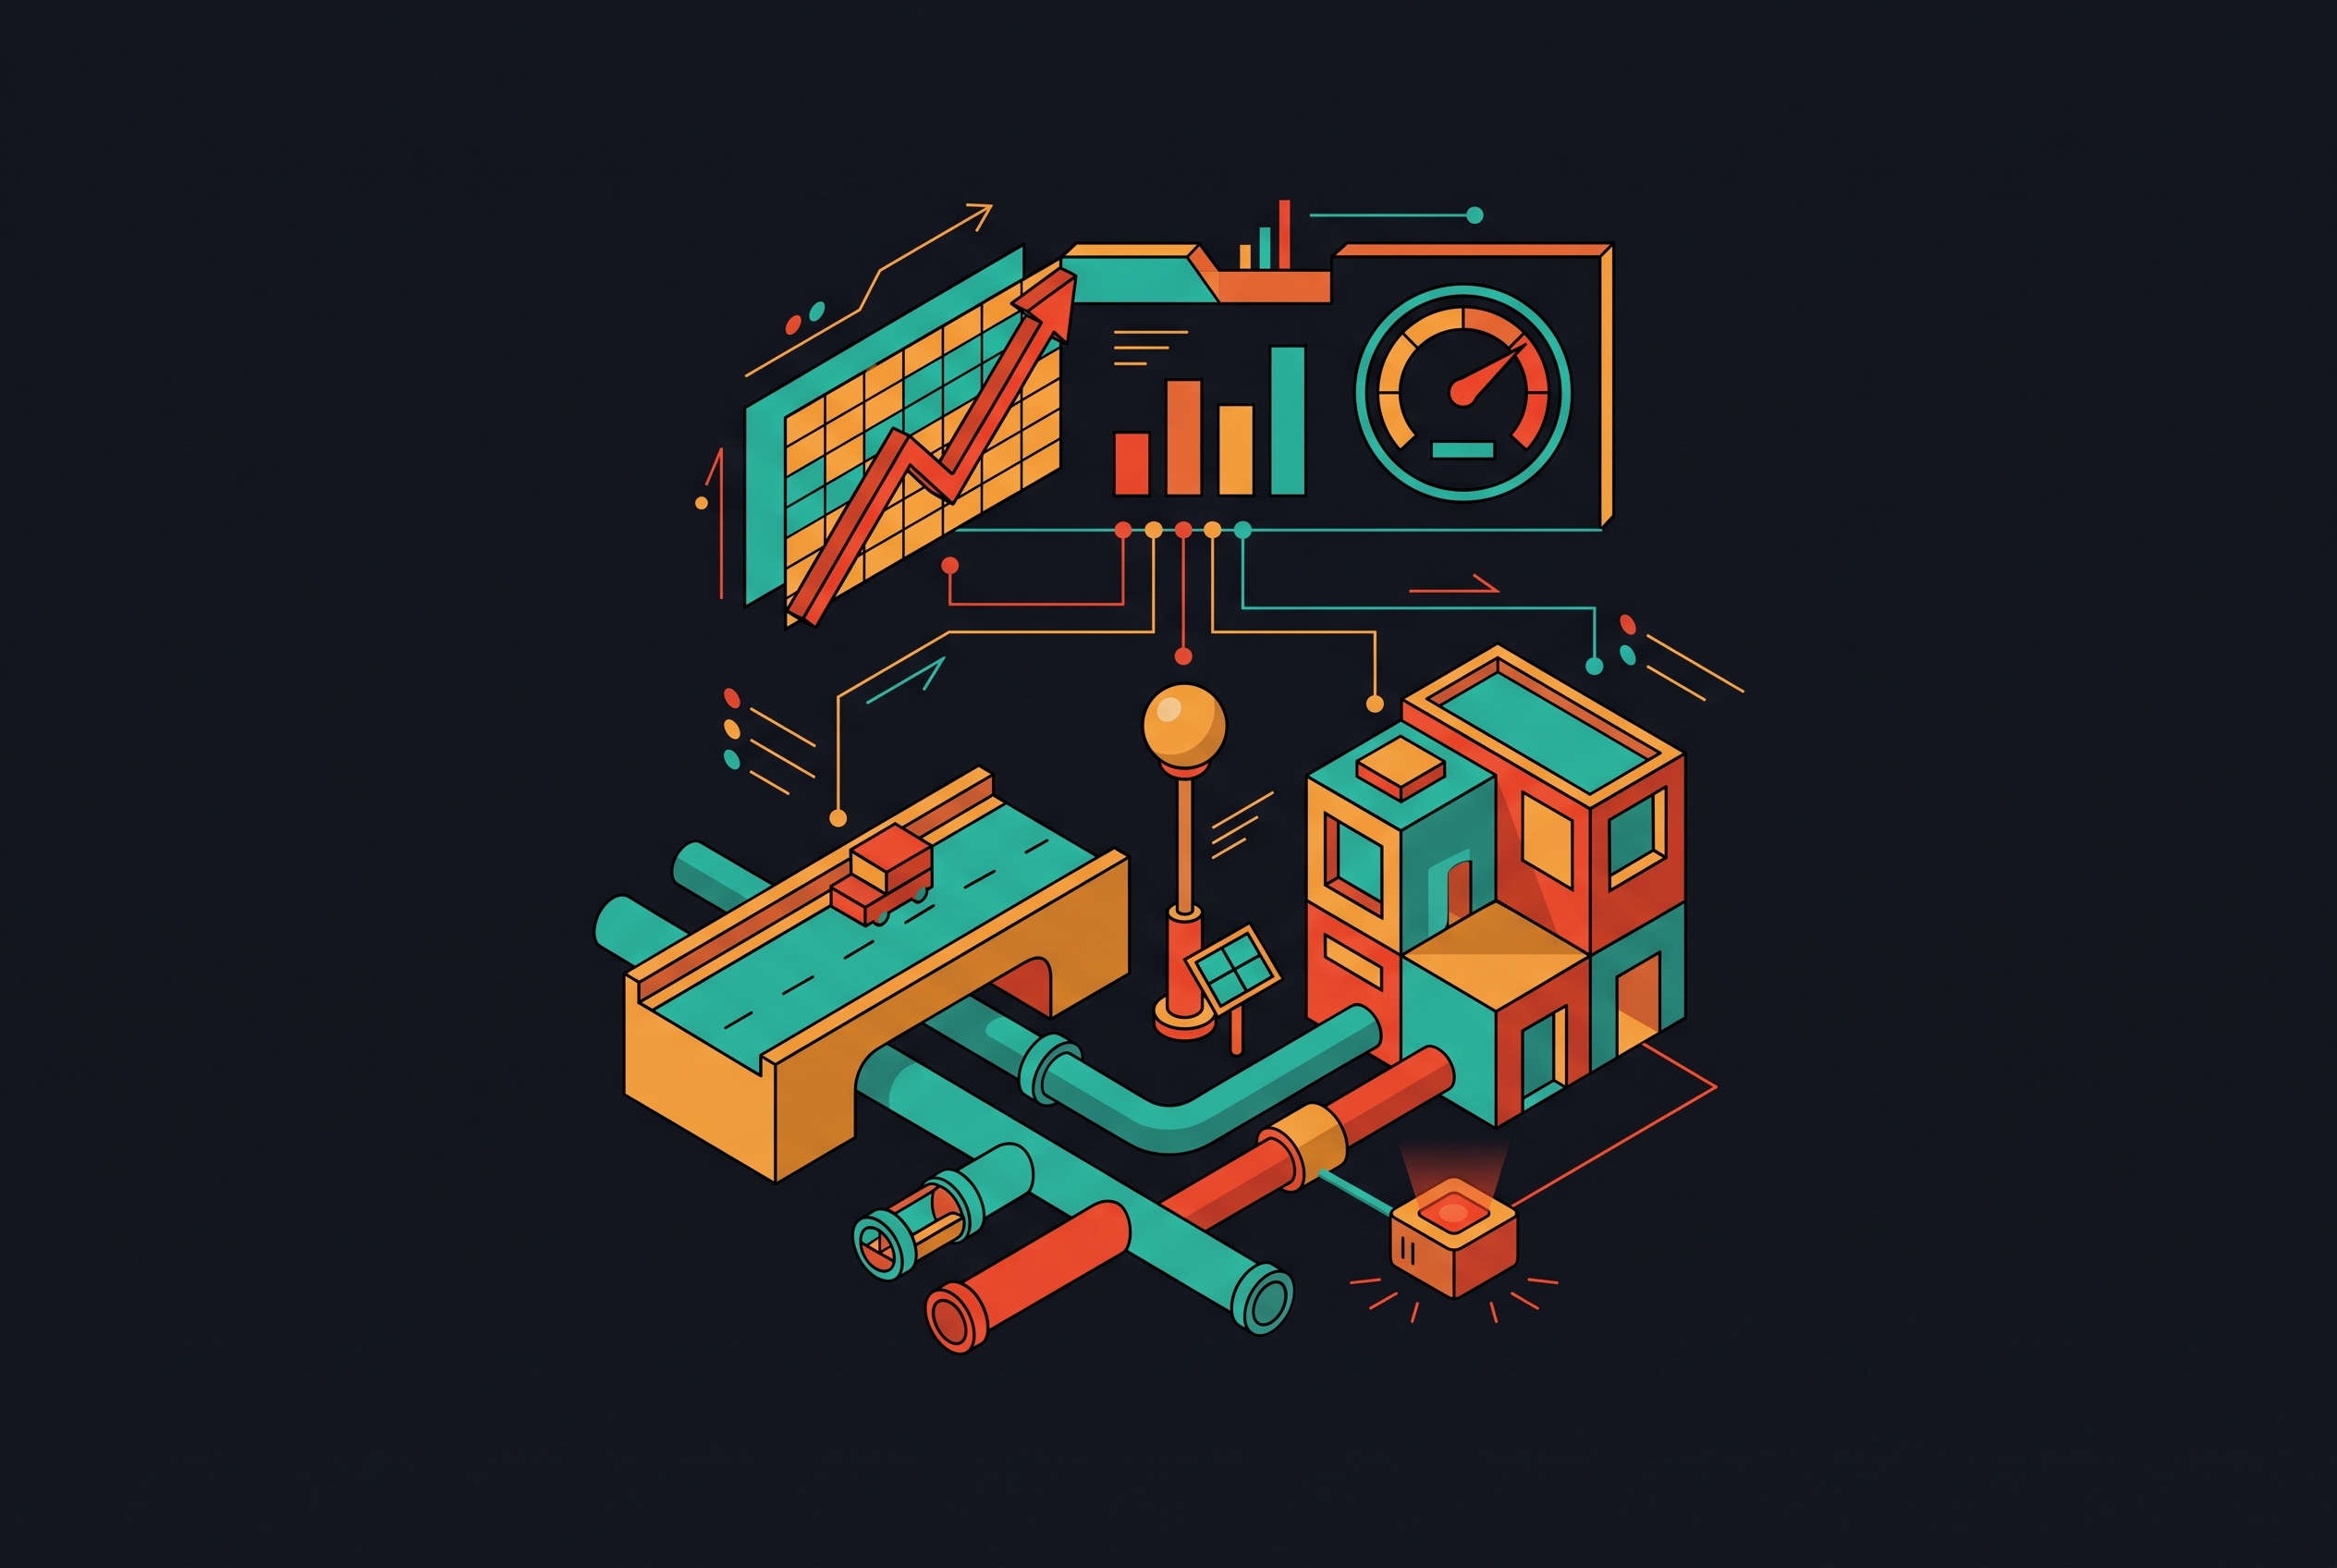
On the infrastructure side, machine learning chews through sensor telemetry from bridges, pipelines, and power lines and flags degradation patterns 30 to 90 days before something actually fails. That's a maintenance alert instead of an emergency call.
Speaking of emergencies: if a storm damages a bridge or floods a road, the platform can push alerts immediately and model alternate routes for first responders on the spot. Energy and climate teams use it too, tracking building performance in real time and running microclimate models to spot heat islands before they become a public health story.
Public engagement gets a real upgrade as well. Instead of handing residents a 40-page PDF nobody reads, planners can hand them an interactive 3D model they can rotate and zoom into. Des Moines, Iowa used exactly this approach to check the impact of future development on sightlines to the state capitol's golden dome. Small, specific, and exactly the kind of granular question a spreadsheet can't answer but a 3D model can.
There's an equity angle too. Because the platform can model impacts down to the community level, it reveals distributional effects that a citywide average would otherwise smooth over and hide.
Cities that have moved past pilot programs into operational deployment
This isn't hypothetical anymore. ABI Research puts the number of transformative urban digital twin deployments above 500 as of 2025, and nine cities show up as confirmed in that research: Newcastle, Rotterdam, Boston, New York, Singapore, Stockholm, Helsinki, Jaipur, and Amaravati.
Singapore's is the headline case. Virtual Singapore, a $73 million investment, is billed as the world's first national-scale digital twin. The database stitches together millions of photos, vegetation data, healthcare access points, and underground infrastructure across the city-state, and planners use it to check how new buildings affect urban climate and traffic flow.
Helsinki built its Energy and Climate Atlas around real-time monitoring of building energy performance and heat-island modeling, tracking progress toward carbon neutrality by 2035. The city won a Bentley Systems award for the effort. Hamburg took a slower, less flashy road: its geoinformation agency and the City Science Lab at HafenCity University have spent years jointly building technical standards and collaborative frameworks, rather than buying a platform off a shelf and hoping it works.
Then there's Toronto, the cautionary tale everyone in this space eventually brings up. Sidewalk Labs planned a smart-city neighborhood built on digital twin technology, and it got cancelled in May 2020, officially due to a widespread public-health crisis that had thrown the economy into uncertainty, though regulatory and privacy concerns had been dogging the project long before that crisis showed up. The lesson is that governance and public trust decide outcomes just as much as the technology does, maybe more, even when digital twins work." It's that governance and public trust decide outcomes just as much as the technology does, maybe more.
The platforms and vendors building this infrastructure
Three names dominate: Microsoft, Siemens, and Dassault Systèmes. Siemens led the pack with just over 5.2% market share in 2025, and the top five vendors combined held 17%, according to ABI Research and Marketintelo. Translation: this market is still wide open, nobody's cornered it yet.
Esri's ArcGIS Urban manages the development pipeline itself, folding in BIM data, outside 3D content, and permitting records to speed up project review, and again, no 3D data required to start. Its CityEngine tool released a 2025.0 beta in May, priced at $2,200 a year for the US professional tier. The results can be dramatic: Documented deployments show cloud infrastructure enabling dramatic reductions in mapping timelines for cities using Esri tools. That kind of compression is not an incremental improvement, it's a different category of speed.
Bentley Systems partnered with Microsoft to weave Azure IoT Digital Twins and Azure Maps into its iTwins platform, the same company whose award Helsinki won for its Digital City Synergy project. Cityzenith built its name on infrastructure and energy-efficiency twins with SmartWorldPro, and recently donated its SmartWorldPro2 platform to select cities through the "Clean Cities, Clean Future" campaign aimed at carbon neutrality. Iotics rounds out the list as one of 2025's notable providers, focused on event-driven twin systems that let governments share real-time data across infrastructure types instead of locking it in one department.
Siemens Smart Infrastructure teamed up with Esri too, pairing Esri's mapping and spatial analytics with Siemens' electrical grid expertise for power network planning and maintenance. And behind all of this, more than 175 member organizations have joined the Digital Twin Consortium's open-standards effort. Interoperability is turning into a shared industry project now, not a feature vendors fight over.
How cities are making the financial case for deployment
The return-on-investment numbers are hard to argue with. 92% of companies deploying digital twins report ROI above 10%, and roughly half clear 20%, putting this among the fastest-payback infrastructure bets a city government can make.
Frame it as cost avoidance and the logic gets even sharper. Cities face compounding risk from climate events, population growth, and infrastructure that's simply getting old, and reacting after the fact is expensive. A city that spends tens of millions cleaning up flood damage could have spent a fraction of that on a simulation layer that flagged the vulnerable zones and rerouted stormwater infrastructure years ahead of the storm.
Money is also moving from software licenses toward services. Software made up 66.32% of 2024 revenue in urban planning, per Mordor Intelligence, but the services side is growing faster, at a 7.46% compound annual rate. Cities are increasingly bundling integration work, workflow mapping, and change management into the initial contract. Municipalities are buying an outcome, not a software seat, and vendors have caught on.
On the buyer side, 59% of executives say they plan to integrate digital twins by 2028, which means adoption has moved past the early-mover phase and is heading toward standard procurement.
Where adoption is concentrated and why geography shapes the market
Asia Pacific leads on raw volume. Big infrastructure programs across China, Singapore, India, and Japan, stacked on top of fast urbanization, make it the fastest-growing region for this technology, full stop.
Europe's story is different, and it's not about who has the bigger budget. Strict data privacy rules and sustainability requirements have pushed vendors there to build platforms that are more tightly governed from the start, and data-governance requirements shape how digital twin deployments are structured across the region. Hamburg's approach, that slow multi-year build-out of standards and data-sharing culture with HafenCity University, is the European model in miniature: earned over time, not deployed as a turnkey box.
North America, meanwhile, held 38% of digital twin revenue share in 2024, according to MarketsandMarkets. That's a large installed base, though national-scale coordinated programs of the kind seen in Asia Pacific have been less common there. All of this sits inside a much bigger smart-city market, projected to grow from $72.52 billion in 2024 to $115.3 billion by 2029, which shapes where vendors point their resources and how procurement actually happens on the ground.
What the market size figures measure, and why the range matters for evaluation
Anyone shopping for a platform is going to run into wildly different market-size numbers, and the confusion isn't because analysts disagree, it's because they're measuring different things. The city digital twin sub-market alone was valued at $4.2 billion in 2025, projected to hit $25.8 billion by 2034 at a 22.5% compound annual growth rate, per Marketintelo. Digital twins for urban planning specifically were valued at $4.5 billion in 2025, headed toward $9.8 billion by 2035 at a 7.8% rate. Zoom out to the entire industrial digital twin market, and MarketsandMarkets puts that at $21.14 billion in 2025, rocketing to $149.81 billion by 2030 at a 47.9% rate.
That's not a typo and it's not a contradiction. It's scope. A city sizing up vendors needs to ask, point blank, whether a quoted figure describes city-specific deployments or the entire industrial digital twin universe, because the gap between a $4 billion market and a $150 billion one is entirely a matter of what's being counted in the first place.
What all three ranges agree on, though, is the direction. Whether the growth rate is 22.5% or 47.9%, every analyst is pointing the same way: up, and fast. The disagreement centers on where the ceiling sits, not on the direction of the trend. Read together, the estimates confirm something simple: urban digital twins have graduated from pilot-program novelty to infrastructure-grade investment, and they're not sliding backward.
The implementation barriers cities need to plan for before they start
None of this comes free, and the barriers deserve to be named instead of glossed over. Cost tops the list in nearly every market report, and municipal procurement cycles, built for one-time purchases, don't naturally fit a deployment that needs constant iteration and support.
Data governance might be the bigger trap. Toronto's 2020 cancellation of the Sidewalk Labs project is the sharpest example in the record, and it collapsed over regulatory uncertainty and public distrust, not because the technology failed to work. Regulatory gaps keep slowing adoption in Canada and similar markets today for the same reason.
Then there's the technical mess of legacy systems: decades-old CCTV networks, utility databases that were never built to talk to anything outside their own department, permitting software running on assumptions from another decade. None of it plugs into a new digital twin layer automatically, and cities have to decide upfront whether to upgrade that old infrastructure first or design the twin to work around it. Layered on top is the organizational puzzle, sorting out who owns the data, who's allowed to see it, and which department answers for it when something goes wrong. That coordination problem, frankly, moves slower than any of the technology involved.
Cybersecurity closes the list as an ongoing responsibility rather than a checkbox. A platform that centralizes a city's infrastructure and population data becomes a single, high-value target the moment it goes live, which makes vendor security practices as important as vendor features.
The growing shift toward services (that 7.46% CAGR against a licensing-dominated 66.32% revenue share in 2024) is really cities responding to all of this at once. They've learned the software alone doesn't fix an organizational problem, so they're paying upfront for change management and integration support instead of discovering the gap the hard way. Hamburg and Helsinki both show what handling this well actually looks like: years of investment in data-sharing culture, shared standards, and cross-department collaboration, not a single big-bang procurement announcement followed by a ribbon-cutting.
Sources
- Digital Twin Market Size & Share | Forecast Report 2026-2034
Provided the 5.2% and 17% vendor market share figures cited in the platforms section.
- Digital Twin Market Size, Share, Latest Trends & Growth Analysis, 2025-2030
Provided the North America 38% revenue share figure and the broader industrial digital twin market size and growth projections.
- Digital Twins and Smart Cities: A New Era for Urban Planning and Services | IoT For All
Provided the smart-city market size figures of $72.52 billion in 2024 and $115.3 billion by 2029.
- Digital Twin For Urban Planning: $4.5B, 92% ROI Market[2026]
Provided the ROI figures (92%, 20%), executive adoption survey (59% by 2028), and urban planning digital twin market valuations ($4.5 billion, $9.8 billion, 7.8% CAGR).
- Urban Planning Software And Services Market Size, Share & 2030 Growth Trends Report
Provided the software revenue share (66.32% of 2024 revenue) and services CAGR (7.46%) figures for urban planning.
- https://marketintelo.com/report/city-digital-twin-market
Provided the city digital twin sub-market figures: $4.2 billion in 2025, $25.8 billion by 2034, and 22.5% CAGR.
- https://www.abiresearch.com/press/transformative-urban-digital-twin-and-city-modeling-deployments-exceed-500-2025
Provided the figure of over 500 transformative urban digital twin deployments as of 2025 and the list of nine confirmed cities.