Predictive Analytics for Urban Infrastructure Maintenance
Machine learning forecasts infrastructure failures before they become expensive emergencies.
What predictive analytics does (and what it does not)
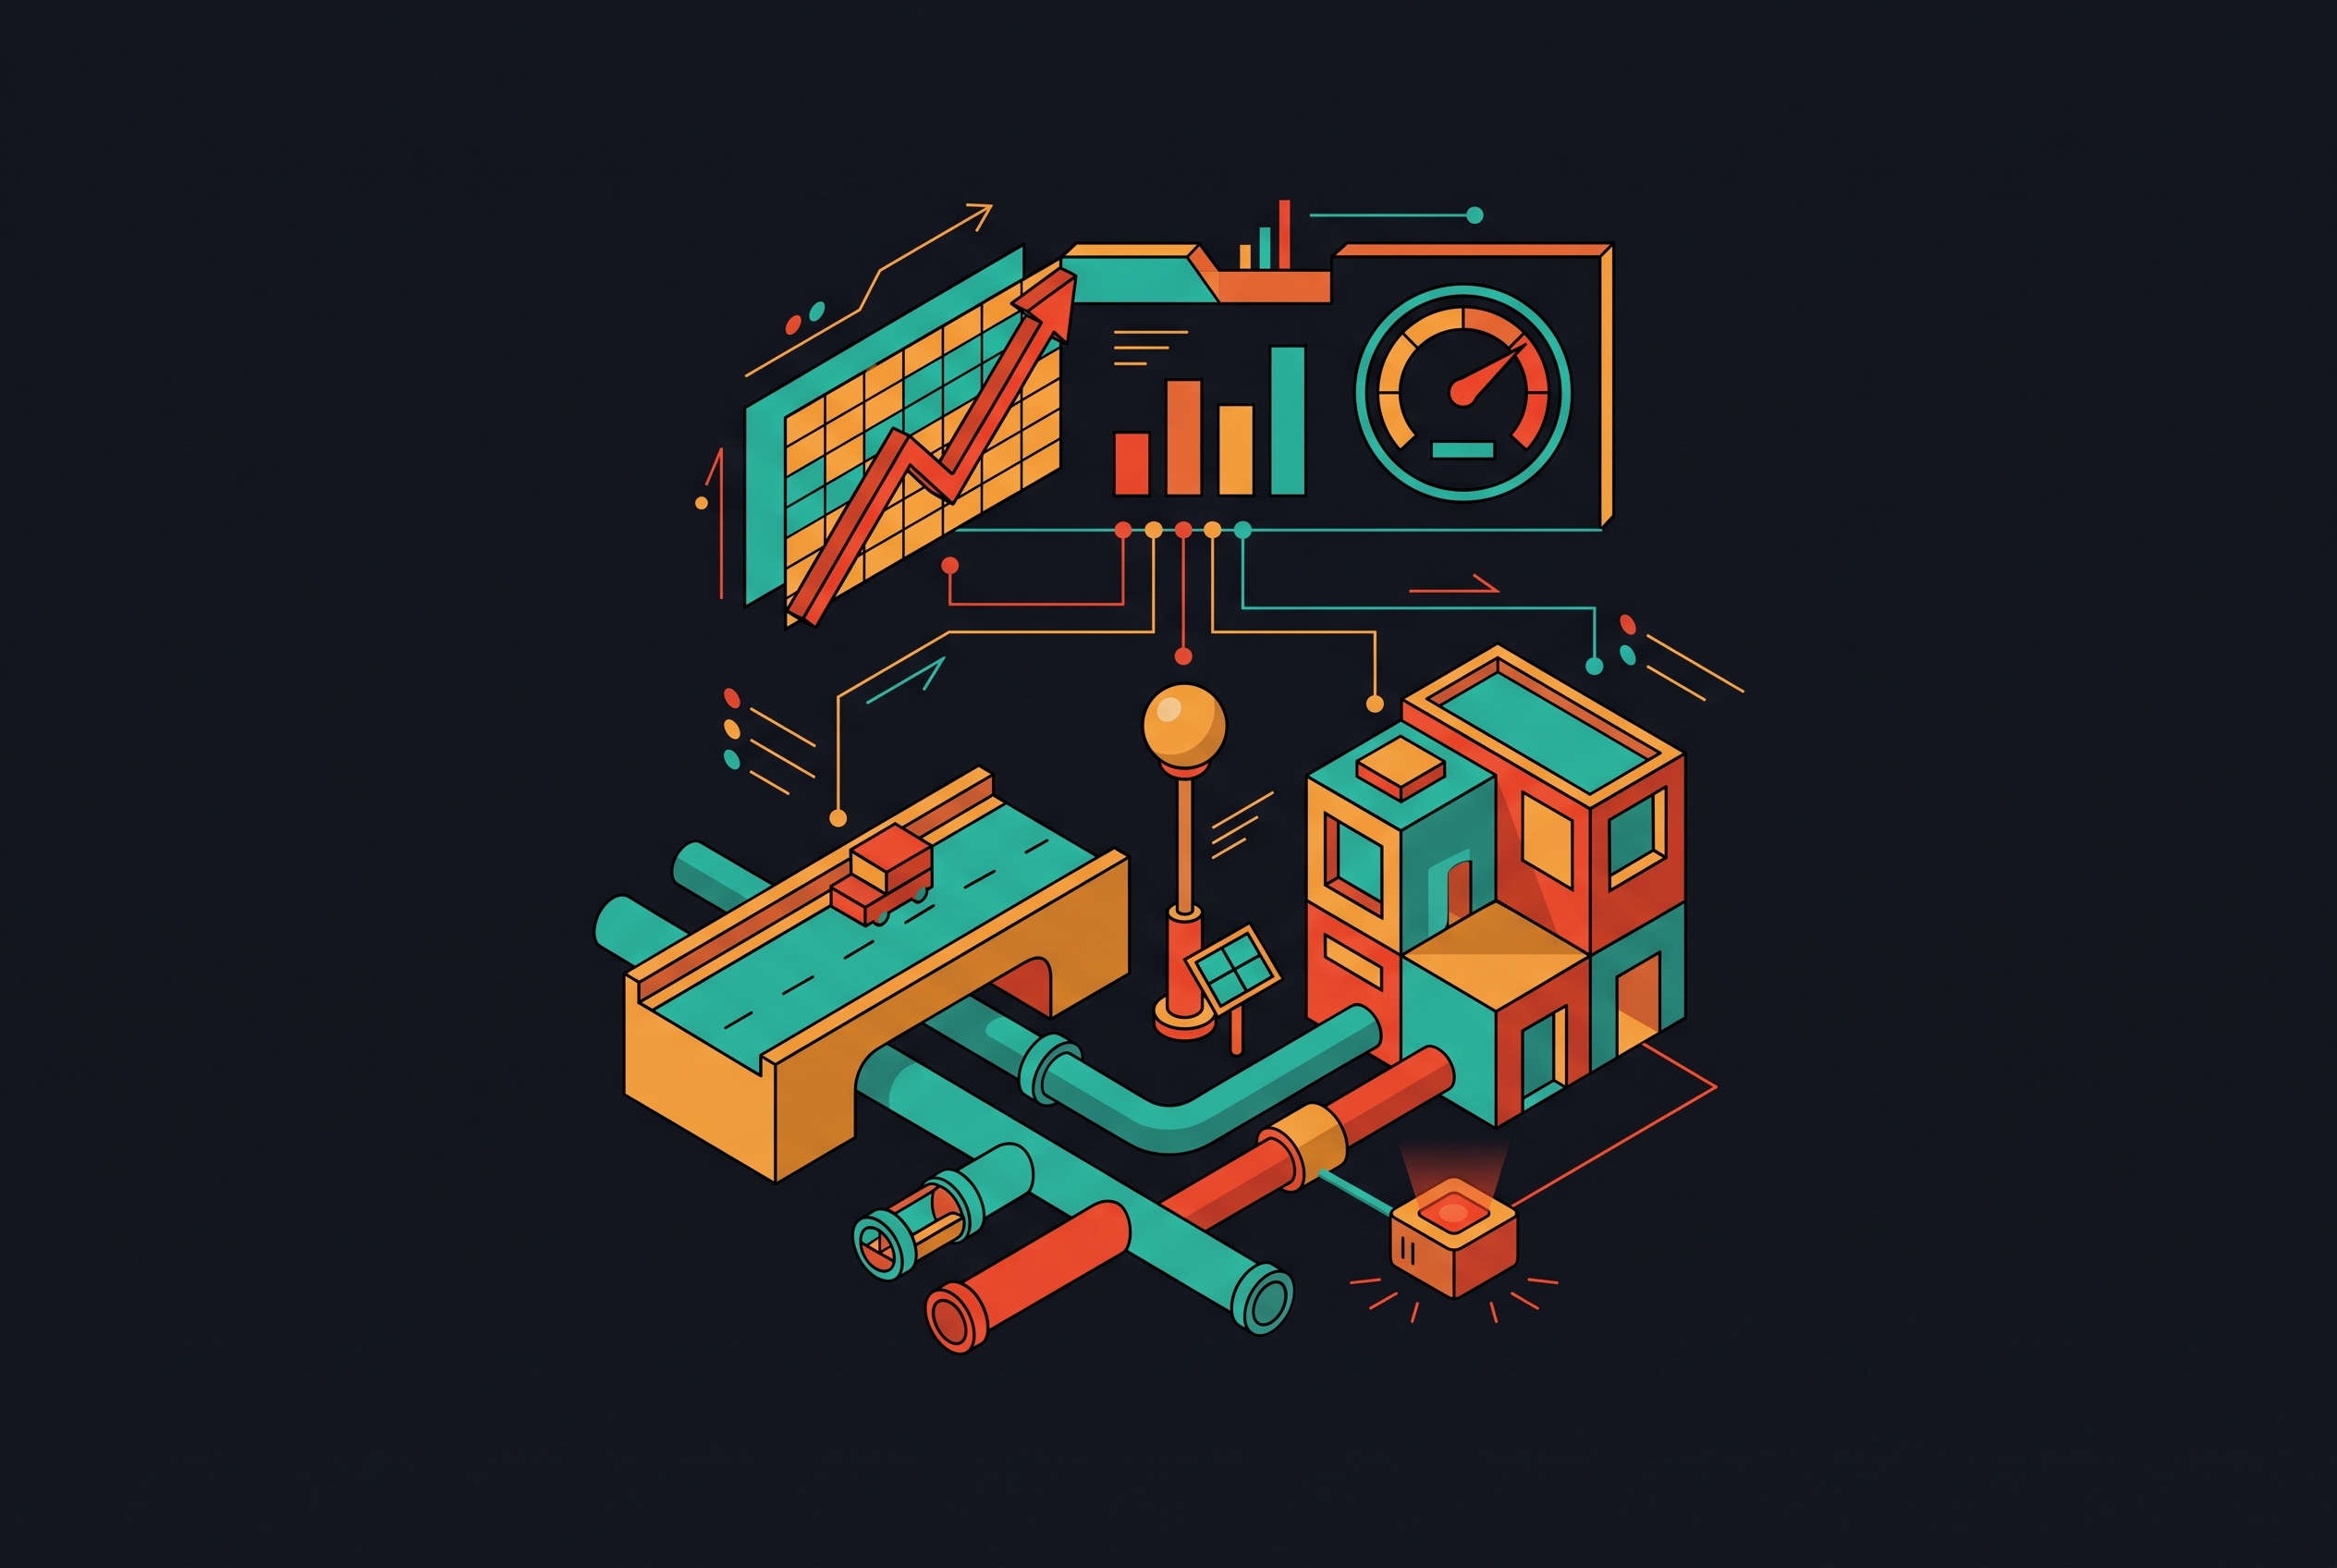
Predictive maintenance runs machine learning on past failures, live sensor feeds, and weather data to figure out when an asset actually needs attention, not when a spreadsheet says its 90 days are up. That's the whole idea, and it's a sharp break from preventive maintenance, which still services equipment on a fixed calendar no matter what shape it's in. Cities lose money every year to emergency repairs that only get scheduled after a citizen calls to complain, and the whole point of a predictive system is to catch the narrow window between "still working fine" and "about to quit," updating that estimate as new data rolls in.
A SCADA system throwing an alarm because a sensor crossed some fixed threshold is not predictive analytics. That's a smoke detector with a better interface. The real shift is from rule-based alerts to failure forecasts that come with a confidence score attached, and the output should be a ranked list, not a red light: which asset needs a crew first, how much life it has left, what the repair costs, how many people notice if it fails. A traffic signal about to die on a six-lane intersection outranks a flickering bulb in a park, and a decent system says so out loud instead of leaving a dispatcher to guess.
Most cities are stuck choosing between two bad options. Calendar maintenance replaces parts on schedule regardless of condition, so crews swap parts too early half the time and too late the other half. Break-fix is worse: it waits for the complaint, then sends a crew out at emergency rates because the problem already became one. Manual inspection can't close the gap either. A technician can only stand in one place at a time, and the cheap fix window for a failure typically closes before the failure becomes visible above ground. Aging pipes and bridges, tighter budgets, rougher weather: all three are landing on cities at once, and none of it stays abstract for long. A burst water main is what turns into a call to a council member's office by lunchtime.
This piece sticks to physical infrastructure: water mains, bridges, streetlights, transit systems. Not the servers running payroll. Keeping the scope that narrow is what makes the rest of this useful instead of theoretical.
The four-layer pipeline: how sensor data becomes a failure forecast
Start with what's actually collecting the data. Vibration sensors on water pumps, voltage monitors on streetlight controllers, strain gauges bolted to bridge decks, air-quality sensors inside public buildings, all feeding one pipeline alongside SCADA feeds, weather APIs, and old work order records. Getting that data off a bridge deck or out of the ground in the first place is its own fight. A standard short-range wireless router just gives up down there. LoRaWAN, 5G, and edge computing are among the approaches used to reach underground pipes and remote assets where standard connectivity falls short.
Once the data's moving, machine learning models hunt for degradation patterns specific to each asset type: mechanical wear in a pump, component aging inside a streetlight driver, corrosion progressing through a pipe wall. These models sharpen the longer they run on a given city's own infrastructure, since local conditions, materials, and operating patterns shape how each city's assets degrade. Fusing sensor readings with maintenance history and weather forecasts builds a picture no single data source produces alone. The modeling itself has moved past static SCADA thresholds toward LSTM and autoencoder models running multivariate anomaly detection together, and a peer-reviewed EAI Endorsed Transactions study found XGBoost hit 98.9% accuracy in multiclass failure diagnosis, the top result in that comparison.
From there the system calculates remaining useful life for each asset, ranks by failure odds and repair cost and citizen impact, then automates the response. A work order gets generated with location, diagnosis, parts needed, priority. Routing sends the nearest qualified technician. The completed repair feeds back into the model to sharpen the next forecast. Sense, analyze, dispatch, learn, repeat. That closed loop, not any single sensor or model, is the actual difference between a predictive system and a wall of blinking lights.
The urban assets that deliver the clearest return on predictive monitoring
Not every pipe and pole is worth wiring up, and pretending otherwise is how budgets get burned on sensors nobody needed. The payoff is greatest where failure is expensive, dangerous, or impossible for citizens to ignore quietly. Water systems sit at the top of that list, no real competition.
Acoustic leak detectors, pressure sensors, and flow meters catch pipe failures well before they escalate, flagging leaks, pump wear, and pressure drops before anyone loses service. Real deployments report water loss cut by roughly a quarter and emergency repairs cut by more than half.
Street lighting comes right after. AI can flag a failing ballast or driver weeks in advance, which lets crews batch replacements instead of rolling a truck out for one bulb. That batching substantially cuts costs versus reactive dispatch, and IoT-connected systems have driven steep drops in resident lighting complaints. Reported figures from Berlin's AI-driven street lighting initiative cite electricity use cut by 40% in test districts through sensor-driven control and load optimization, though independent verification of deployment outcomes remains limited.
Bridges get continuous monitoring from strain gauges, accelerometers, and crack sensors, with AI cross-referencing load data against temperature swings and material aging to forecast maintenance two to six weeks out. Traffic systems land next: a broader MDPI Technologies review of 30 studies found AI-driven transport models cutting congestion 25% and travel times 18% across the board, a modest number next to some vendor claims but a far more trustworthy one. Public buildings round it out. Occupancy sensors and HVAC monitors catch compressor wear, clogged filters, and duct leaks before they become a comfort complaint or a wasted utility bill, and that same MDPI review found 15% energy savings across AI-driven infrastructure use cases.
What Singapore and Berlin's deployments reveal about real-world results
Singapore has integrated IoT infrastructure alerts and AI-driven traffic management into its Smart Nation program, extending real-time infrastructure status and predictive transit management across the network. Singapore has become one of the most closely watched examples of city-scale predictive infrastructure deployment anywhere.
Berlin's street lighting project, already mentioned, delivered that 40% electricity cut in test districts through sensor-driven control and AI load optimization. Elsewhere, large-scale IoT smart city deployments have bundled connected traffic systems, energy management, and public safety networks into unified operational platforms, showing the scale these projects can reach when the budget matches the ambition.
What ties Singapore, Berlin, and that Indian metro deployment together is that the system scales in each case, without leaning on one sensor type or a standalone dashboard. All three pair sensor networks with centralized analytics and automatic work order dispatch. None of them answer the harder question, which is how this plays out for a mid-sized city running fragmented, decades-old systems on a fraction of that budget. That case study doesn't exist yet, and it's the one most cities actually need.
The digital twin gap: why most systems are not as smart as they appear
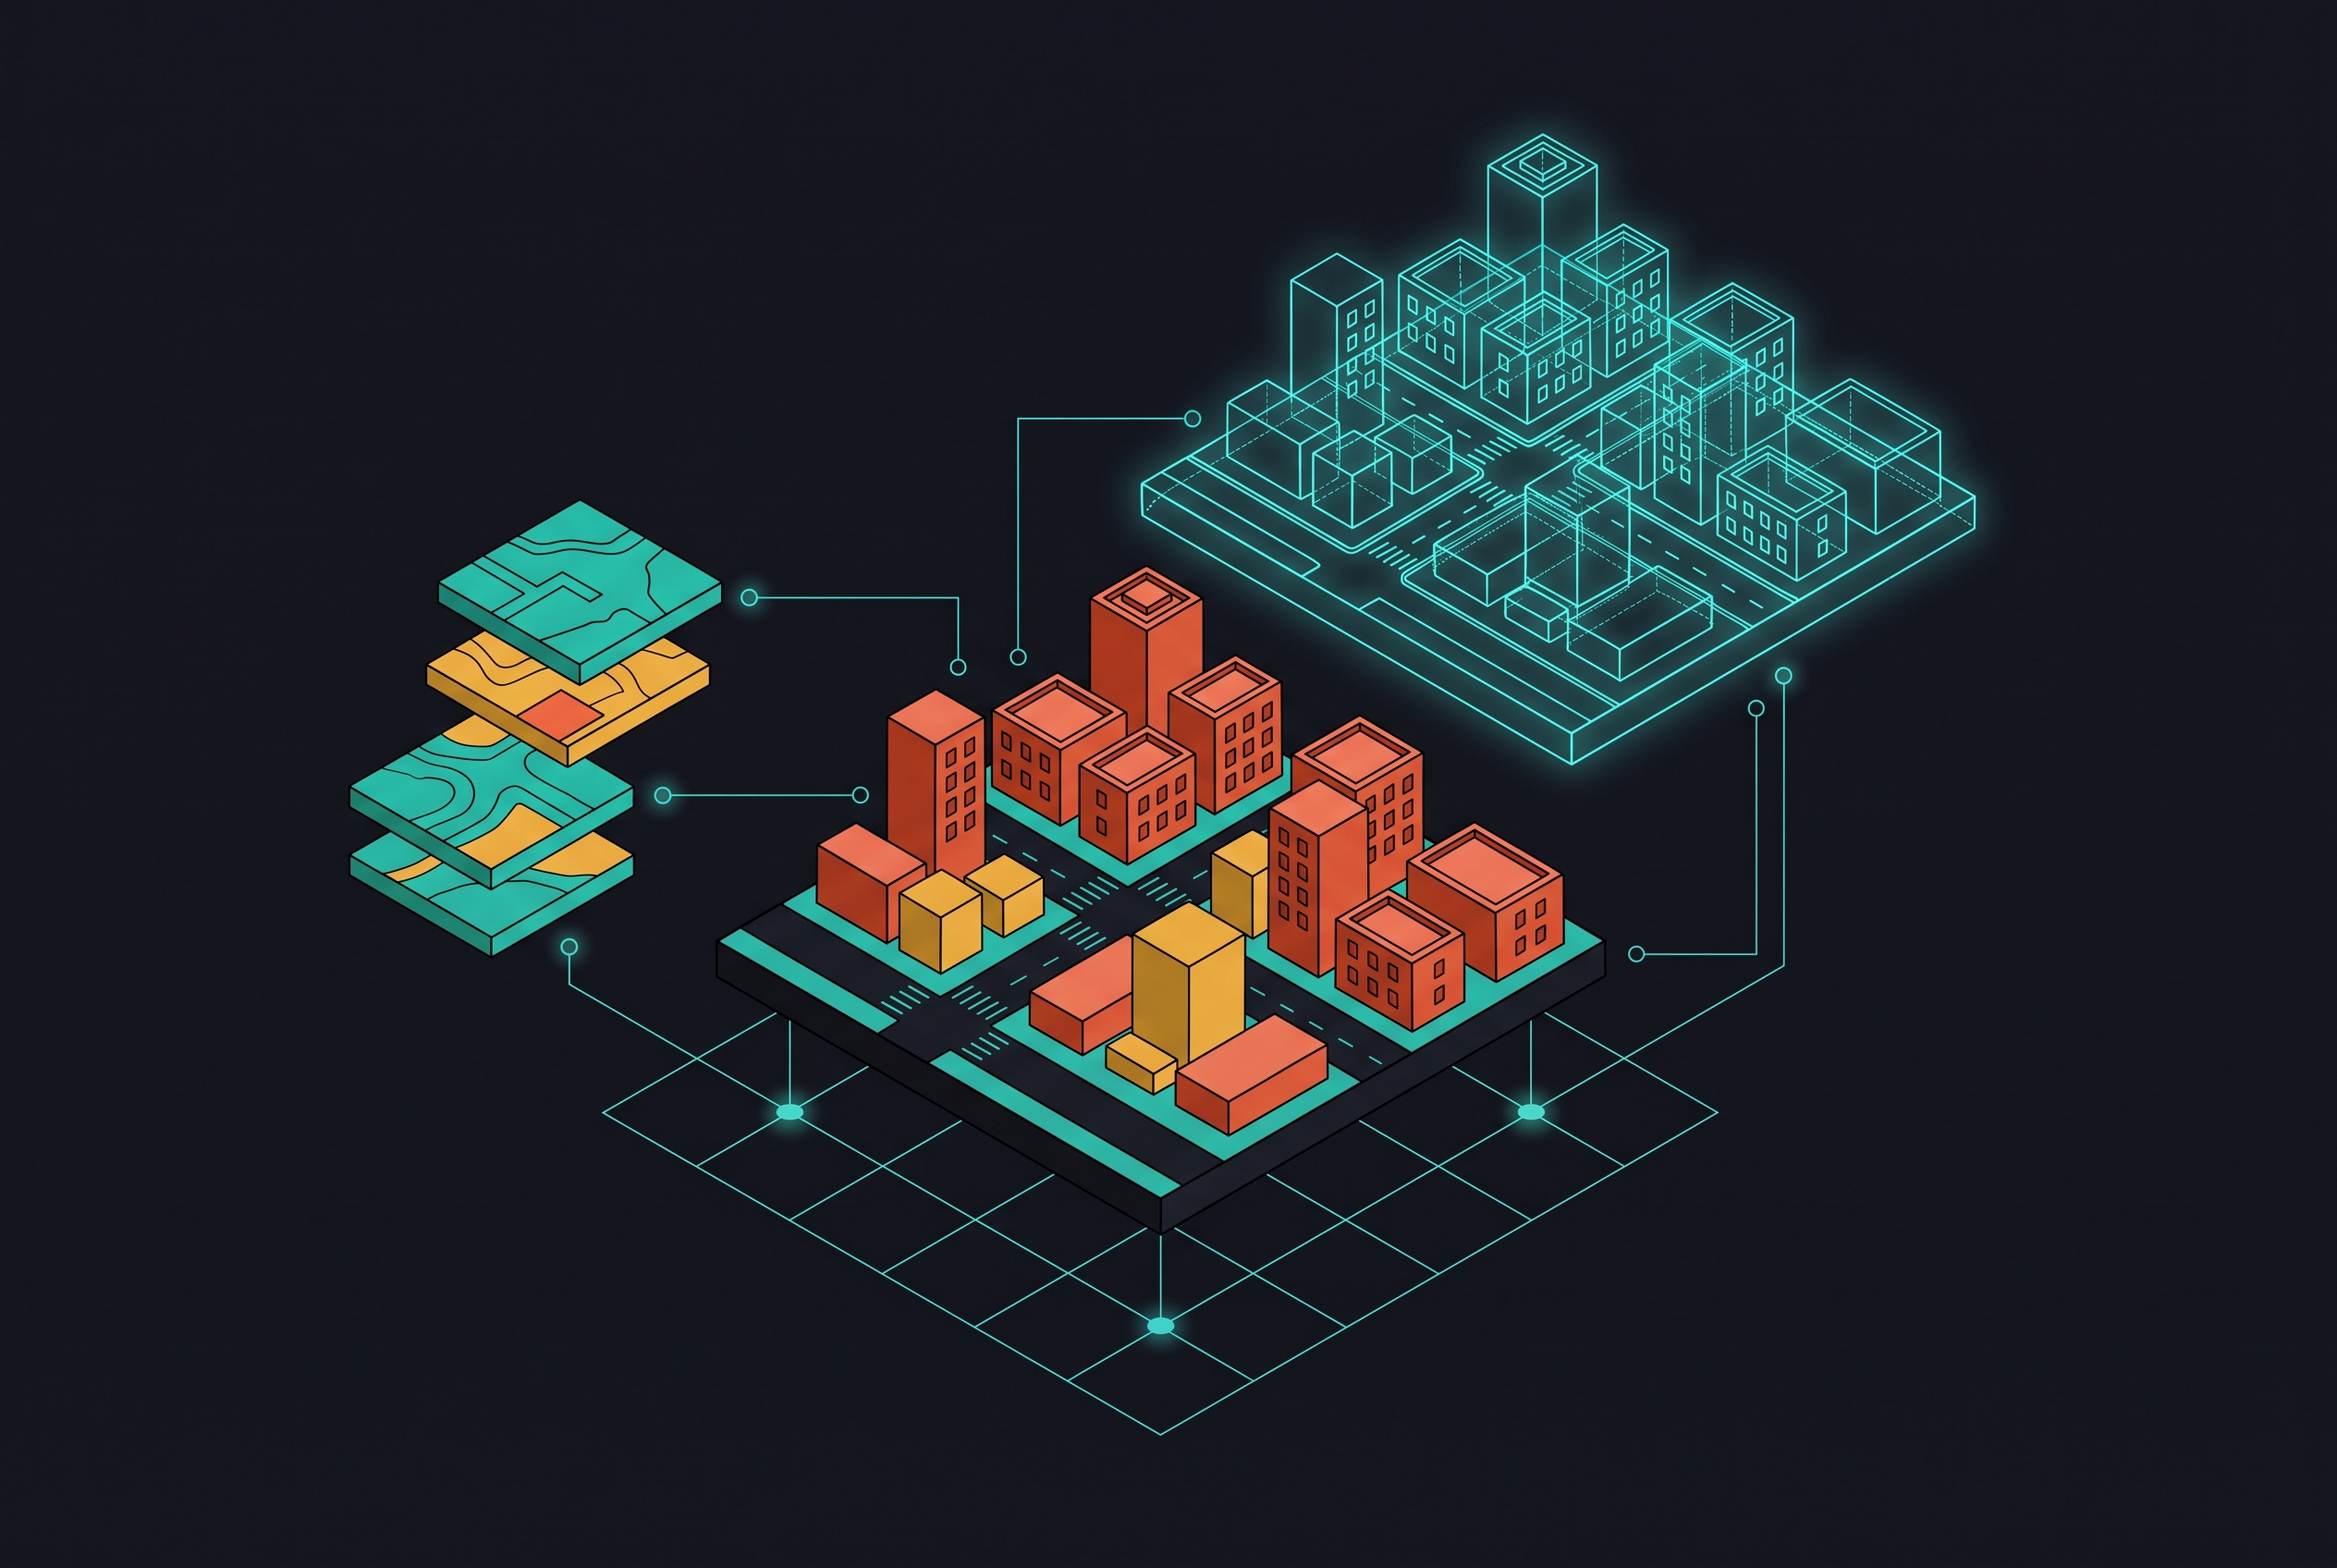
Digital twins get sold as a living virtual copy of every asset in a city, one that updates itself and corrects course automatically. Reality falls well short of that pitch. A systematic review in MDPI, covering 73 peer-reviewed railway infrastructure studies, found what it called a "Digital Twin Gap": most of these systems only run one direction. Data flows in and a model updates, but the findings of that MDPI review point to limited evidence that outputs reliably change what happens on the ground. Call it a very expensive mirror, one that looks great in a demo and does nothing at 2am when a pump starts failing.
Researchers also describe an "adoption without impact" paradox: organizations buy the digital twin software but skip building the data governance and internal skill base needed to get any value out of it. Cities buy the tech. The operating model around it never catches up. Cost, data privacy concerns, limited computing resources, and limited model interpretability are other challenges commonly cited in the literature.
Safety-critical systems carry their own version of this problem. Railway operators, for good reason, service equipment before it ever fails. As a result, there's almost no real "run-to-failure" data to train a model on for predicting remaining useful life. That same shortage occurs anywhere a city can't afford to let something actually break just to see when it does. A system that collects sensor readings and puts them on a dashboard is not a predictive maintenance system. It's a very expensive photo album. The real test is that the model's output changes what a crew does that morning.
The organizational and security barriers that stall implementation
A peer-reviewed industry study on ScienceDirect found every single respondent named organizational friction, not technology, as their biggest obstacle. Departments that don't share data, priorities that conflict, maintenance teams reluctant to hand decisions over to a model. The tech was never the hard part, and treating it like the hard part is why these programs stall.
Staffing makes it worse. Running a program like this well takes people fluent in mechanical systems, data science, and network security all at once, and that combination is rare on any job market right now. Veteran technicians need training just to read what a model is telling them, and data scientists often don't know enough about the physical asset to sanity-check their own output. The graduating pipeline that already knows both sides takes years to catch up with demand.
Security is its own animal. Hooking IIoT sensors up to cloud analytics means connecting operational technology networks that sat air-gapped for decades to the same IT infrastructure that runs everything else. Getting IEC 62443 compliance in place typically takes 12 to 24 months, and while both IEC 62443 and the NIST Cybersecurity Framework lay out how to secure an IIoT deployment, neither sets a mandatory waiting period before a city can go live at scale. Smart Cities Dive's expert panel named OT and IoT systems (transportation, utilities, public safety) among the most dangerous security blind spots cities face in 2026, precisely because monitoring there stays thin and protections stay weaker than on the IT side.
Generative AI front ends now let technicians query maintenance systems in plain sentences instead of learning a query language, but the data underneath is often a mess, and that bad underlying data is the real problem: it produces wrong answers regardless of how natural the query interface feels. A chatbot sitting on top of bad data just delivers wrong answers with more confidence. It just delivers wrong answers with more confidence. None of this is meant to scare anyone off the idea. It's meant to make sure nobody walks in expecting a plug-and-play rollout, because that rollout doesn't exist.
Three implementation paths and what each requires of city teams
Three legitimate paths exist here, and the right one depends on asset criticality and budget, not on which vendor pitches the loudest. Augment in place runs 6 to 8 weeks, hybrid migration runs 8 to 12, full modernization runs 10 to 14. All three keep the existing CMMS in place, reuse sensors already installed, and target a 30 to 50% cut in unplanned downtime within the first quarter after launch.
Augment in place is the right call for most cities, and the ones skipping straight to full modernization are usually solving a problem they don't have yet. It layers AI anomaly detection on top of the SCADA and CMMS systems already running, without ripping anything out. Lowest disruption, fastest results. Hybrid migration goes further: it moves the highest-stakes asset classes, usually water and lighting, onto the new system first, while everything else stays put for now. That approach needs data-sharing agreements between departments locked in before anything deploys, or it stalls halfway through. Full modernization replaces the fragmented CMMS and scattered dashboards with one unified platform. It costs the most going in, and it's the only path that actually kills the data silos capping how accurate any model can get, but it's overkill for a city that hasn't even fixed its data-sharing agreements yet.
The existing work order system gets integrated with, never thrown out. CMMS-plus-AI, not CMMS-or-AI. Before any of these three paths go live, a city needs a data governance plan spelling out who owns which asset's data and how an anomaly gets escalated, a cybersecurity review against IEC 62443 or NIST, and an actual plan to train technicians on reading model output rather than just clicking through a new screen. Start with the assets where failure costs the most or gets noticed fastest, and regardless of path, a human signs off before a model gets to reclassify an asset or shift a maintenance strategy. Safety-critical infrastructure has no room for a wrong answer nobody double-checked.
Evaluating whether a predictive maintenance program is working
Three numbers matter most: the drop in unplanned downtime, with cross-industry benchmarks putting the target at 35 to 50%; the shift in spend from emergency repairs to planned maintenance; and how close the model's remaining-useful-life estimates land to actual failure dates.
None of that means anything without a baseline. A city that's never tracked unplanned downtime has no way to prove it went down, so measuring the "before" picture is the entire foundation any ROI claim stands on.
A quiet reporting period should raise a question, not get filed as a win. If a monitored asset shows zero predicted failures, that could mean the model caught every problem early and headed it off, or it could mean the model isn't catching anything. Those two outcomes look identical on paper and sit at opposite ends of reality, and a program needs a way to tell them apart before it claims credit for either.
The same scrutiny applies to any number thrown around without context. A vendor claiming a 30% reduction in something means nothing without knowing how many assets, over what stretch of time, measured against what starting point, and a city should hold its own internal reporting to that exact same bar. When evaluating a vendor, ask whether the system reports a confidence score alongside each failure forecast. A model willing to say "94% confidence" is telling a city something it can act on. A model that just blinks red is no different from the smoke detector this whole approach was supposed to replace.
Sources
- 14 predictions about what 2026 may hold for cities
Provided the expert panel assessment naming OT and IoT systems as major security blind spots cities face in 2026.
- AI and IoT in Smart City Infrastructure: 2025 Global Trends Report
Supplied the figures on electricity reduction in Berlin's street lighting initiative, the congestion and travel time reductions from AI-driven transport models, and the unplanned downtime reduction benchmarks.
- Predictive Maintenance in Smart Cities: Enhancing Public Infrastructure
Provided the benchmark figure of 30 to 50% reduction in unplanned downtime cited for the implementation paths section.
- https://publications.eai.eu/index.php/airo/article/view/9975
Provided the XGBoost 98.9% accuracy figure in multiclass failure diagnosis cited in the modeling section.
- https://www.sciencedirect.com/org/science/article/pii/S1546221825010963
Cited as the peer-reviewed industry study in which every respondent named organizational friction as the biggest obstacle to implementation.
- https://arxiv.org/pdf/2602.09846
Provided the systematic review findings on the Digital Twin Gap in railway infrastructure studies, including the lack of bidirectional feedback in most deployed systems.