Distributed Energy Infrastructure Permitting and Interconnection
Permitting and interconnection delays are killing solar and battery projects before they start.
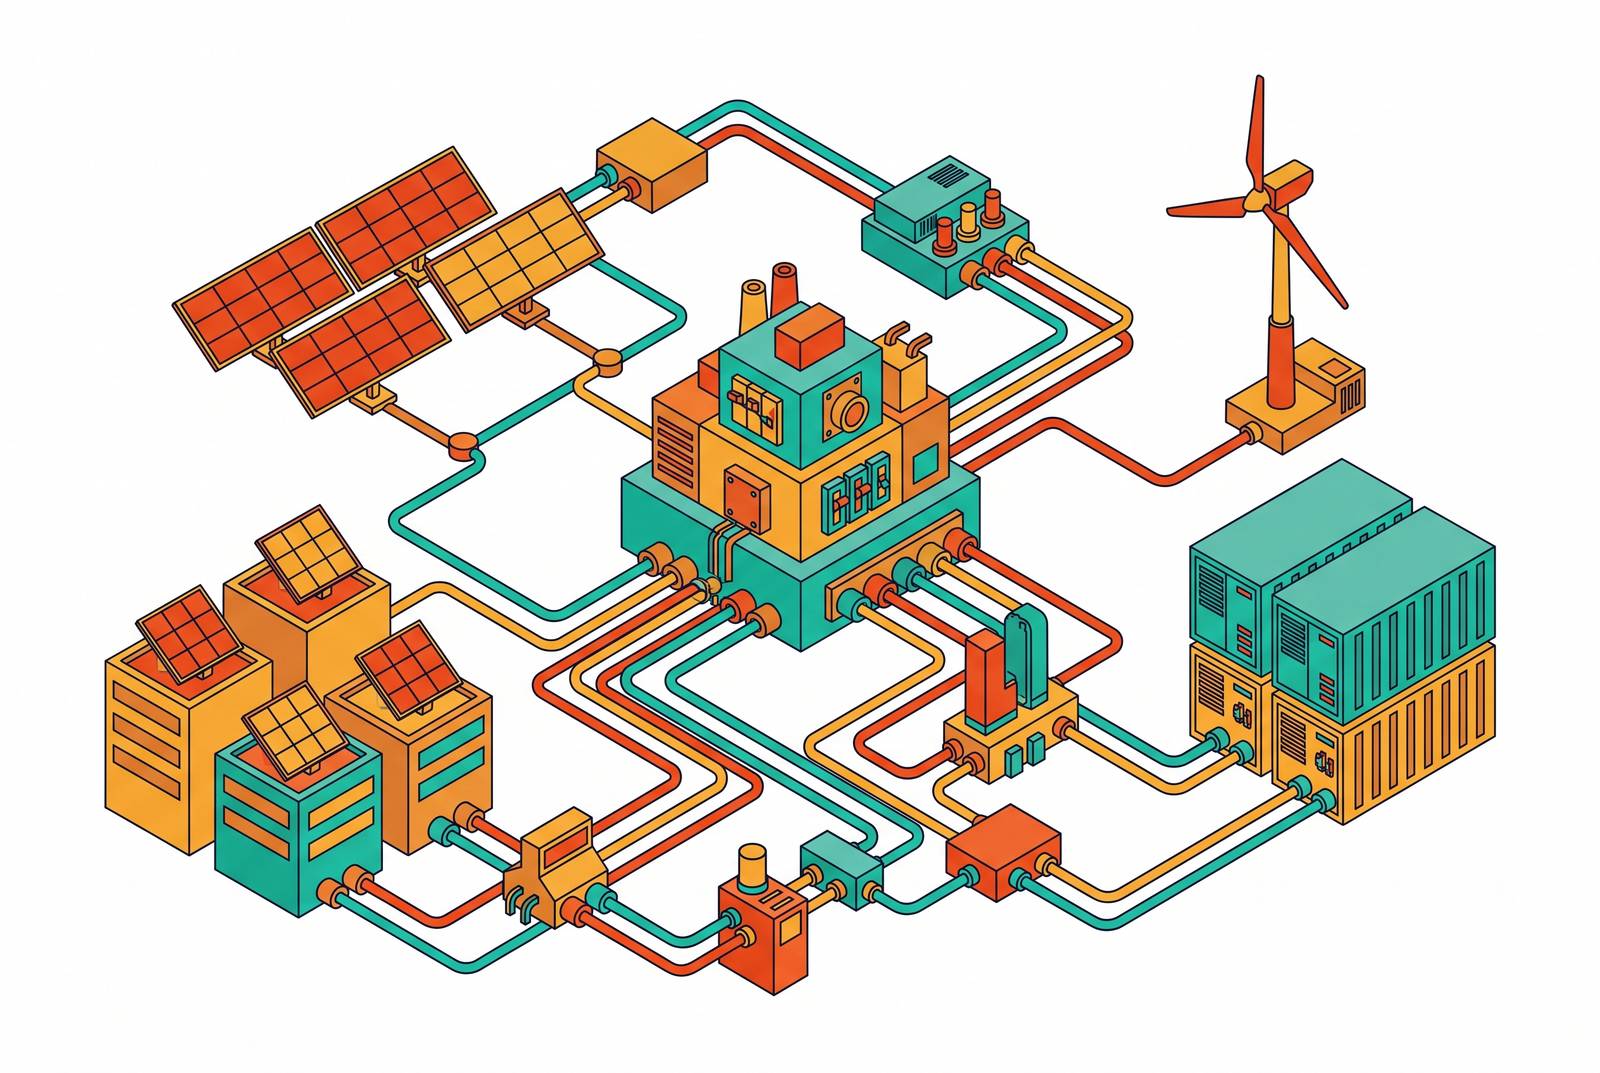
Distributed energy resources, the rooftop solar, community solar, battery storage, EV chargers, and small wind projects that plug into the local grid, face a two-layer gauntlet before they ever produce a watt. One layer is local permitting: zoning, building codes, land use. The other is grid interconnection: the utility and grid operator's technical review process. Clearing one doesn't clear the other, and that gap is where a lot of good projects go to die slowly.
How the grid interconnection process works from application to operation
The basic sequence looks simple on paper: submit an application, get a queue position, go through technical screening, then a system impact study, then a facilities study, sign an interconnection agreement, build the thing, commission it, and finally, operate it. In practice, each of those steps is its own bottleneck with its own paperwork.
There are two regulatory tiers here, and mixing them up is a rookie mistake. Big transmission-level projects fall under FERC and get studied by RTOs and ISOs. Smaller DERs sit at the distribution level, where state utility commissions and individual utility tariffs call the shots.
Some states offer an expedited lane for smaller systems. Con Edison's SIR process in New York, for solar projects between 50 kW and 5 MW, is a good real-world example of how the paperwork actually flows: a completeness review that takes 10 business days, preliminary screens at 15 business days, an optional supplemental screen if the first pass raises flags, then a CESIR study running 60 business days from its start date, followed by payment milestones before the agreement gets issued.
Utilities are supposed to hand developers a specific set of data throughout: hosting capacity maps, projected upgrade costs, study start and end dates, queue position, and screen results. Developers, in turn, have to show up with their own homework done: rated power in kW, stored energy in kWh, technology type, exact substation or feeder location, and IEEE 1547 categories covering reactive power and disturbance behavior. Miss any of that, and the file gets kicked back.
The old-school version of this process studied every project one at a time, strictly in the order it arrived. First-come, first-served sounds fair. It also means one slow project at the front of the line holds up everyone behind it, like a single cart blocking the only checkout lane. That serial model is the baseline every reform effort since has been trying to fix.
The scale of the backlog and what the queue numbers actually mean
By the end of 2024, roughly 10,300 projects were actively seeking interconnection, adding up to about 1,400 GW of generation and around 890 GW of storage. That's a small country's worth of electrons waiting for a hall pass, not a queue.
The backlog peaked near 2,600 GW active at the end of 2023. It's eased since, down 10% into 2025, landing at 2,061 GW actively seeking connection, a real drop but a modest one. Total active volume fell 12% in 2024 compared to the year before, helped along by record withdrawals: a combined 112 GW of solar and storage capacity pulled out of the queue that year.
Breaking it down by technology tells its own story. Solar sitting in the queue fell to 956 GW. Storage fell 13% to 890 GW. Wind dropped 26% to 271 GW. Meanwhile active natural gas capacity jumped 72% to 136 GW, a shift in composition that's worth flagging on its own, since it suggests developers are reading the room differently depending on fuel type.
None of these totals should be read as a forecast of what actually gets built. Plenty of queue entries are speculative, placeholders, or projects that'll quietly vanish before ever breaking ground. The next section explains just how few of these entries make it to the finish line.
Demand isn't slowing down to wait for the queue to catch up, either. Forecasts point to more than 150 GW of additional capacity needed within five years, by 2030, driven by AI data center growth, industrial reshoring, electrification, and aging generation retiring off the grid.
Why so few projects in the queue actually reach operation
Of capacity that submitted interconnection requests between 2000 and 2019, only 13% had actually reached commercial operation by the end of 2024. Seventy-seven percent had been withdrawn. Ten percent were still sitting in the queue, waiting. Those are Lawrence Berkeley National Laboratory numbers, and they should reframe how anyone reads a queue total from here on out.
The projects that do make it aren't exactly sprinting through. The typical project reaching commercial operation in 2024 spent an average of 55 months, about four and a half years, in the queue before it. Compare that to projects built between 2000 and 2007, which cleared the queue in under two years median. Projects built from 2018 to 2024 took more than four years, median. The line isn't just moving in the wrong direction, it's roughly doubled.
PJM's numbers are the sharpest illustration. The gap from application to commercial operation there climbed from under two years in 2008 to more than eight years in 2025. Eight years is long enough for a toddler to become a third grader. That's the interconnection timeline for a single solar farm.
Restudies quietly make this worse. When one project in a study cluster drops out or changes its configuration, the utility often has to re-run the analysis for everyone else in that cluster, even the projects that did everything right. It's a bit like a group project where one person turns in nothing, and the professor makes the whole group redo the assignment.
NYISO's backlog has grown substantially in recent years. Battery storage there has it worst: battery storage projects have seen especially low rates of advancing to commercial service. Solar and storage capacity entering queues nationally dropped 47% and 32% respectively in 2024, a decline tied to political uncertainty, high interest rates, tariffs, and, notably, local permitting headaches layering on top of interconnection delay.
What interconnection actually costs and why the disparity between technologies matters
Interconnection costs have climbed 88% over the past decade. That's not inflation catching up, that's a structural shift in who pays for what and how much of the grid needs rebuilding to handle new projects.
Average interconnection costs between 2017 and 2022, broken out by technology: storage came in at $335 per kW, offshore wind at $385 per kW, solar at $253 per kW, and onshore wind at $136 per kW. Natural gas, by contrast, sat at just $24 per kW. That gap isn't a rounding error, it's an order of magnitude, and it shapes which technologies look "cheap" to build even before construction starts.
Where's the money actually going? Network upgrades. Those grew from around 35% of total interconnection costs in the 2000s to about 85% between 2018 and 2024. The study itself isn't the expensive part anymore, upgrading the wires and substations to handle the new load is.
The split between projects that finish and projects that quit is stark. Projects that withdrew from the queue faced average interconnection costs of $373 per kW. Projects that completed the study process faced just $73 per kW, a five-fold difference. That gap says a lot about how many speculative applications are floating around, inflating cost estimates and confusing everyone downstream.
Cost variability alone should give any developer pause before penciling in a number. A quarter of projects paid under $25 per kW. Another quarter paid more than ten times that. In PJM specifically, active queue projects from 2020 to 2022 averaged $240 per kW, while withdrawn ones averaged around $599 per kW.
The physical infrastructure response to all this is enormous. MISO's Long Range Transmission Planning Tranche 2.1, approved in December 2024, authorized $21.8 billion for 3,631 miles of new 765kV backbone transmission. That's the scale of steel and copper the backlog is forcing into existence.
And all of it eventually lands on a consumer's bill. The renewable-versus-gas cost gap isn't just a developer's headache, it's a fairness question for regulators and ratepayers alike.
How the local and state permitting layer adds a separate set of delays
State and local permitting may be the single biggest barrier to energy infrastructure development in the country, more restrictive in aggregate than anything happening at the federal level. Developers consistently cite restrictive local zoning as a leading challenge, right alongside long interconnection queues and community pushback.
The numbers back that ranking up. Across the country, a growing number of local governments have adopted ordinances, moratoria, or outright bans that block renewable energy development, and the number of contested renewable projects has been rising year over year.
None of this runs through one office. Building permits, electrical permits, zoning variances, conditional use permits, environmental review, and utility coordination can each sit with a different agency, on a different clock, with no shared calendar between them.
For DERs specifically, this creates a coordination problem that's easy to underestimate. Distribution-level interconnection and local permitting both have to clear before a project can flip the switch, and they're usually run by entirely separate teams who aren't checking in with each other. And transmission upgrades triggered by an interconnection study often face their own permitting fights, meaning the physical construction regularly drags on longer than the study process that ordered it in the first place.
Where FERC Order 2023 changed the interconnection framework and where it hasn't yet
FERC issued Order No. 2023 on July 28, 2023, the biggest overhaul of generator interconnection rules in years, aimed squarely at shrinking backlogs and giving developers more certainty. The centerpiece is a switch from serial, first-come-first-served processing to cluster-based, first-ready-first-served processing, where groups of projects get studied together instead of one at a time.
The order added teeth, too: real penalties for transmission providers that blow past study deadlines, plus new co-location rules letting more than one generating facility, including battery storage, share a single point of interconnection and a single application. That last part matters a lot for hybrid solar-plus-storage projects, which used to get stuck navigating two separate processes for what's functionally one site.
The baseline this was reacting to was rough. Among interconnection studies completed in 2022, a substantial majority were issued late.
There are early signs it's working. Interconnection agreements jumped 33% to a record 75 GW in 2024, a jump largely credited to Order 2023 clearing out speculative applications and thinning the backlog. That said, most of the 2024 data reflects applications filed before Order 2023 even took effect, so the full picture is still filling in.
PJM has been the test case to watch. FERC ordered PJM in July 2025 to revise its compliance plan after finding its framework didn't fully meet Order 2023's requirements. PJM finalized new interconnection agreements on November 20, 2025, wrapping up the first transition cycle under its reformed process. PJM has stated its goal of significantly shorter wait times going forward. Whether that's realistic, given the backlog it inherited, is still an open question.
One limit worth underlining: Order 2023 governs FERC-jurisdictional transmission interconnection. Distribution-level DER interconnection answers to state utility commissions instead, so the reform doesn't automatically reach the layer where most rooftop solar and community storage projects actually sit.
What state-level permitting reform looks like in practice
States haven't been sitting still. In 2025, permitting reform bills were introduced across numerous states, and a meaningful share were enacted. That's a meaningful legislative push, even if it's scattered and uneven from state to state.
The approaches vary quite a bit. Some states are preempting local bans outright. Others are trimming down environmental review timelines. A few are setting up state-level siting authorities that can override local zoning decisions for large enough projects, essentially taking the veto away from a single town board.
A federal energy agency's DER Interconnection Roadmap, published in January 2025 and led by its solar and wind technologies offices, organizes solutions around four goal areas aimed at making distribution-level interconnection simpler, faster, and fairer. It's a stakeholder-driven guide, not a binding rule, but it gives states and utilities a shared vocabulary for reform.
Hosting capacity maps are one of the more underrated tools here. Where utilities actually publish them, developers get a heads-up on where the distribution grid has room to spare, which cuts down on speculative applications and the restudy cycles they trigger later.
Community opposition sits outside all of this. A project can be perfectly legal under current zoning and still get stuck in public comment periods, appeals, and political pressure on local boards. Reform bills that fix the legal barriers don't touch that layer at all.
And the procedural landscape still isn't uniform. Cluster study rules, cost allocation methods, and simplified screen thresholds differ by RTO and by state, so developers working across regions are genuinely navigating different rulebooks depending on where the project sits.
What practitioners can do to reduce exposure to the chokepoints in both layers
Site selection is still the single highest-leverage call a developer makes. Available hosting capacity, substation headroom, and proximity to existing infrastructure shape cost and timeline more than almost any decision made after the fact, cluster study reforms included.
Application quality matters more than most teams give it credit for. Projects that show up with complete technical packages, rated power, stored energy, the right IEEE 1547 categories, accurate site data, trigger fewer restudies. Incomplete applications are a well-documented, entirely avoidable source of delay.
Running permitting and interconnection in parallel, rather than waiting for one to finish before starting the other, can shave real time off the schedule. Waiting for a signed interconnection agreement before even starting local permitting work is a good way to add years to a project that's already tight on runway.
Cost estimates from early study phases deserve some skepticism. With a quartile spread running from under $25 per kW to more than ten times that, a single number isn't a budget, it's a guess with a decimal point. Planning across a range holds up a lot better than anchoring to one figure and hoping.
Staying close to the policy process pays off, too. Teams that track RTO and state commission proceedings closely can see rule changes coming, whether that's an Order 2023 compliance deadline, a cluster study window, or a cost-allocation proceeding, before those changes turn into surprises on a project budget.
Withdrawal isn't a clean exit, either. Projects that pull out of the queue face average interconnection costs of $373 per kW versus $73 per kW for the ones that see the process through. Understanding exit costs and optionality before committing to a queue deposit is risk management, not an afterthought.
The demand backdrop isn't going anywhere. More than 150 GW of added capacity is needed by 2030, and that pressure guarantees reform keeps evolving. Whoever understands both layers well enough to move through them today is the one best positioned when the rules shift again tomorrow.