Embodied Carbon in Building Materials and How to Measure It
Cleaner grids are shifting the carbon problem from building operations to the materials themselves.

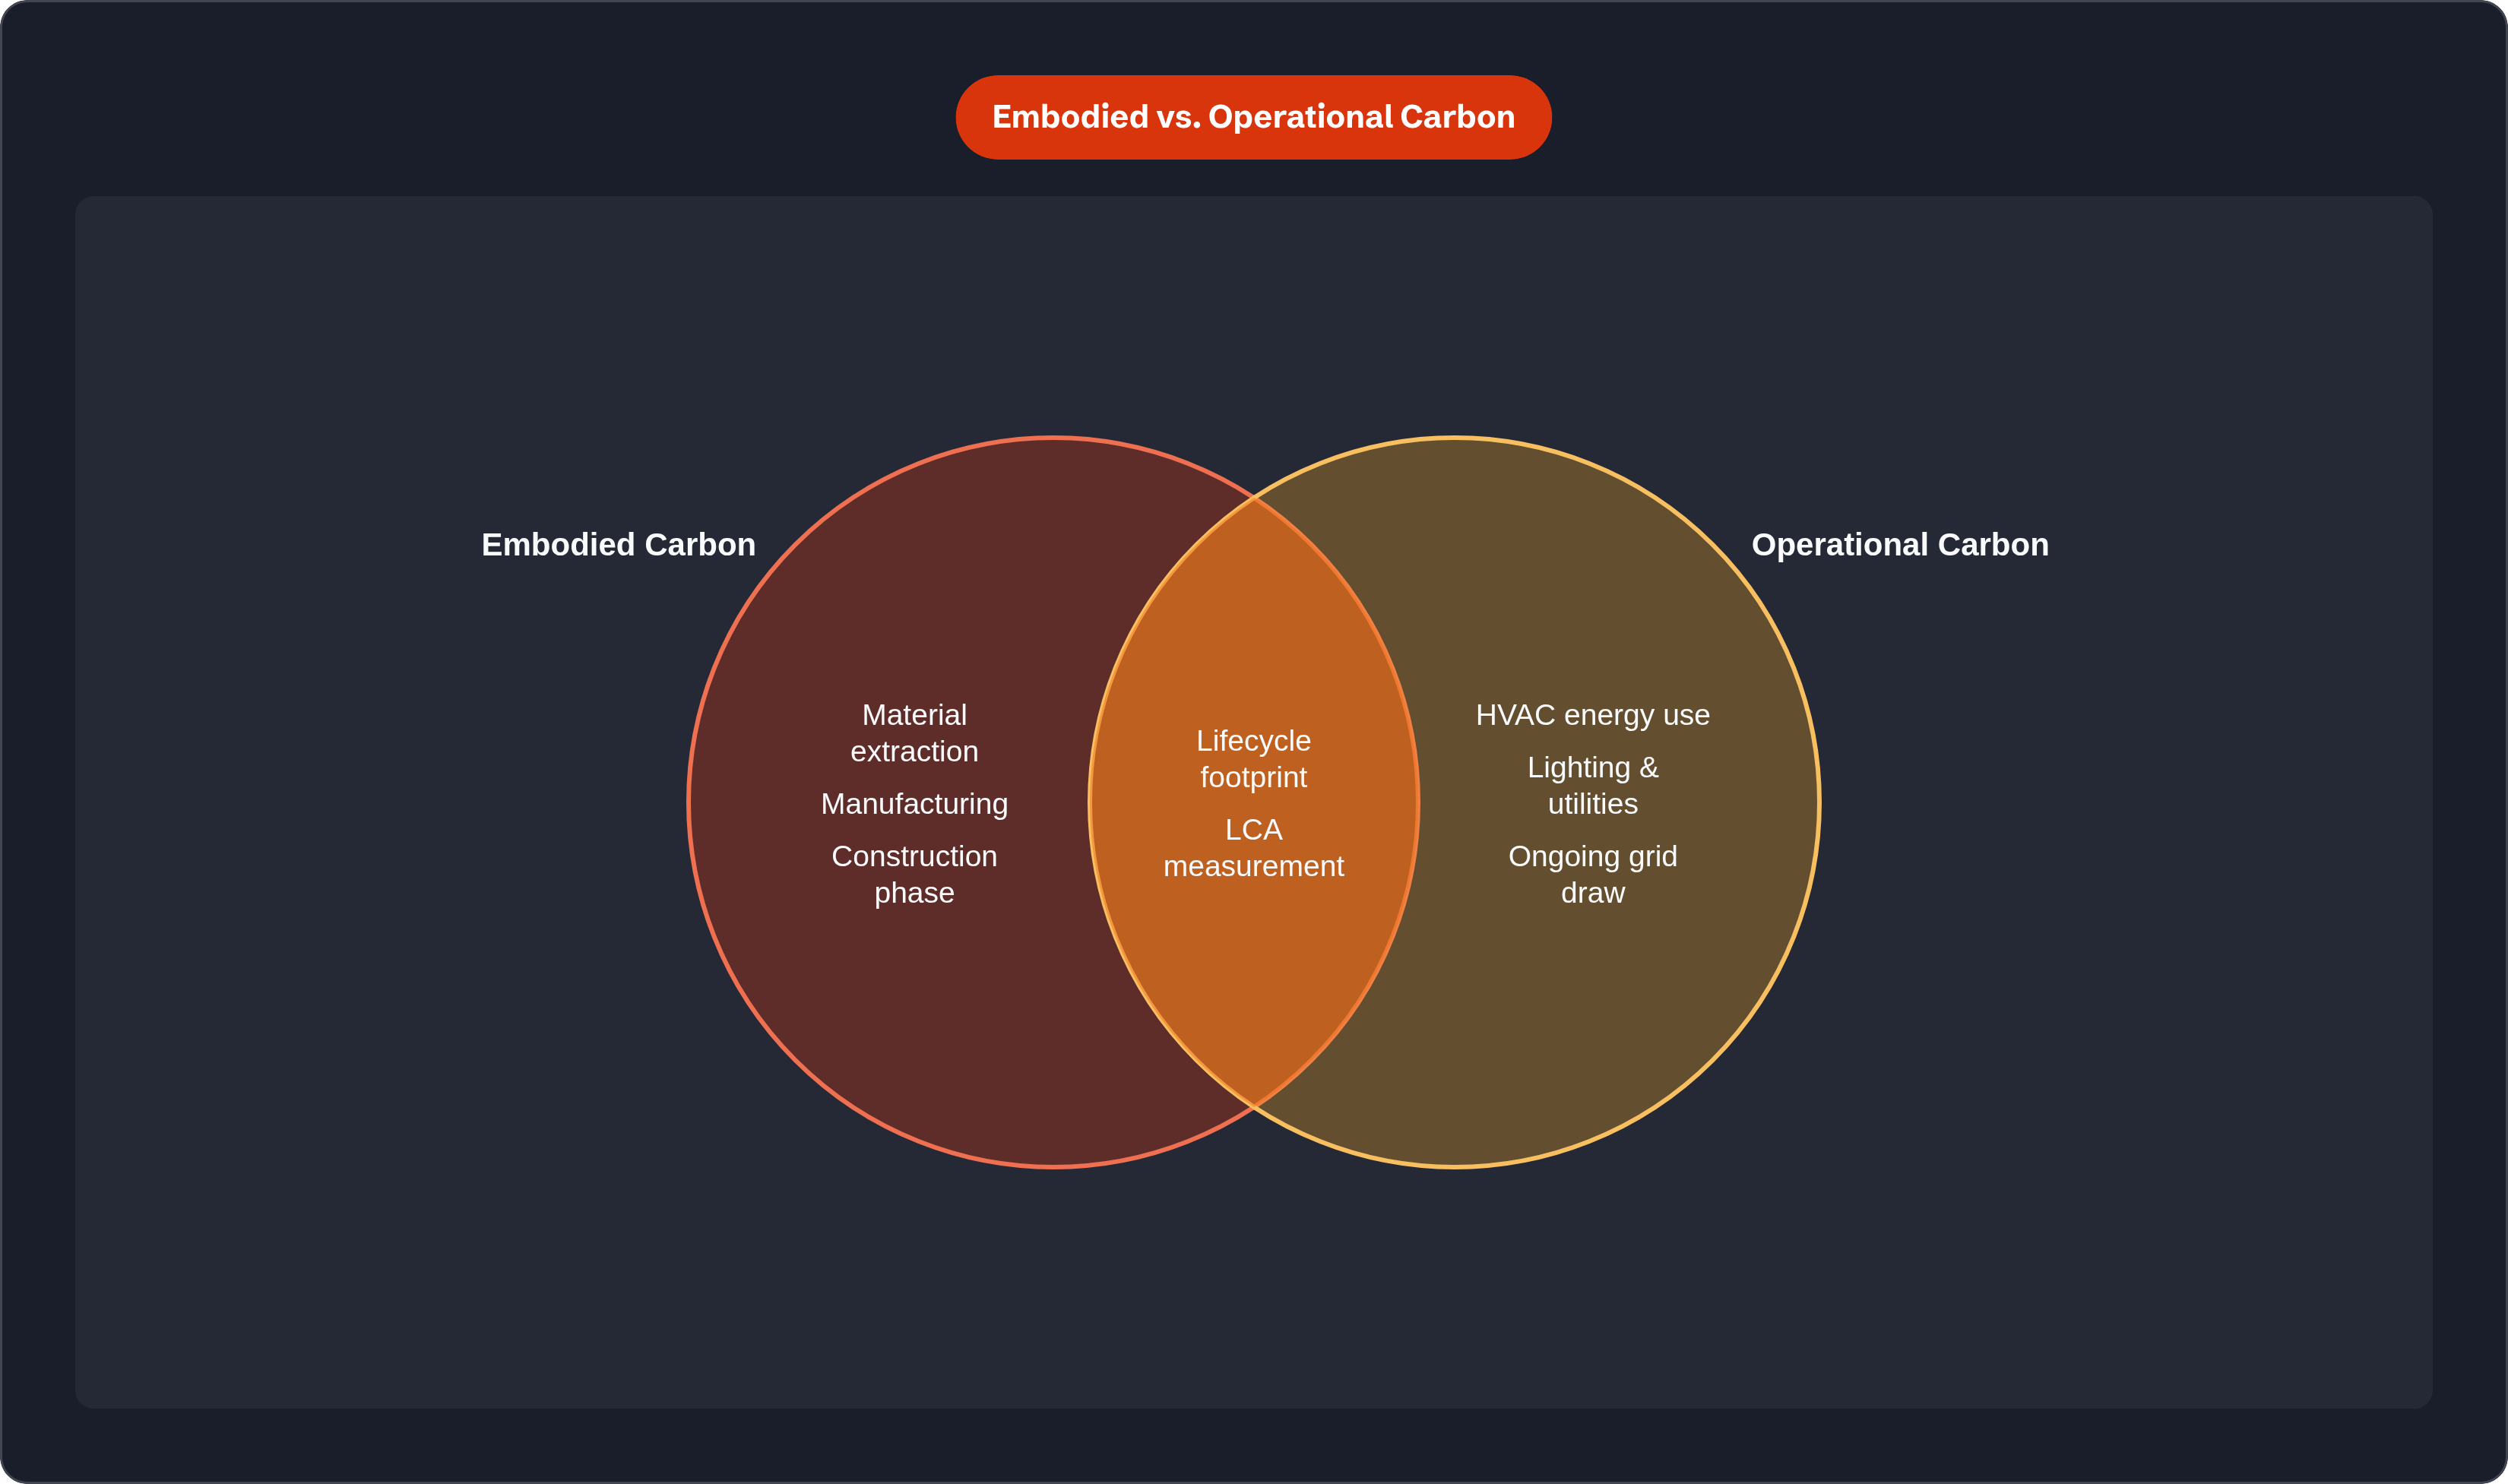
Embodied carbon is every emission tied to a building material, from the day someone digs it out of the ground to the day it gets landfilled or ground up for reuse. Extraction, transport, manufacturing, more transport, construction, decades of maintenance, then deconstruction and disposal — all of it counts. Operational carbon, by contrast, is the energy a building burns to keep the lights on and the HVAC running over its life, and the distinction matters because one of these is already baked into the walls before anyone signs a lease, while the other one hasn't even started yet.
Here's what actually trips people up when they first hear this. Operational carbon flows like a utility bill, a little every month, while embodied carbon lands in chunks. A concrete pour happens once, and a roof gets replaced every 25 years or so; each event dumps a slug of emissions at a fixed point in time, with the biggest slug happening before anyone's even moved in. That upfront chunk, sometimes labeled A1 through A5, is sitting in the atmosphere on move-in day, and no thermostat setting buys it back, no amount of wishful LEED plaque fixes that.
So the boundary matters more than people give it credit for. What counts as "embodied" decides what gets measured in a lifecycle assessment, and right now nobody in the industry fully agrees on where those lines sit. That disagreement is the whole ballgame, honestly, and most of this article is really just walking through the different ways people draw that line.
Why embodied carbon stopped being a rounding error
Buildings and construction account for 39% of global energy-related carbon emissions. Split that number up: operational carbon takes 28%, embodied carbon takes 11%, and for years, that 11% got waved off as noise, but not anymore.
The reason is pretty simple once you sit with it. Grids are adding wind and solar, buildings are getting tighter envelopes and better insulation, so operational emissions keep falling as a share of whole life carbon. Embodied emissions don't fall on their own, though; they just sit there, stubborn, unless someone actually picks a lower-carbon material on purpose. Nobody's out there passively decarbonizing a steel beam.
You can watch this play out already in net-zero and Passive House projects, where embodied carbon sometimes clears half the total lifecycle footprint, which is a preview of where everything else is headed. Canada, Sweden, and Norway sit at roughly a 50/50 split between embodied and operational carbon right now, and it's the same story everywhere, really: cleaner grids push the ratio toward materials. Upfront carbon alone is on track to make up close to half the footprint of new construction between now and 2050.
And the scale problem keeps compounding. Global building stock is set to roughly double by mid-century as the population climbs toward 10 billion, and every one of those buildings involves a pile of material decisions made once, locked in early, nearly impossible to undo later. Yet less than 1% of buildings worldwide have ever had their carbon footprint assessed. So the industry is racing to build twice as much while barely measuring what it's already built, kind of like doubling down at the blackjack table without checking how much money's left in your account.
The five-stage skeleton behind every measurement method
Every serious method for measuring embodied carbon runs on the same bones: ISO 14040 and 14044. These standards split a material's life into five stages, and once you know them, embodied carbon reports stop looking like alphabet soup.
Product stage (A1 through A3) covers extraction, transport to the factory, and manufacturing, and it's where most reported global warming potential figures originate. This is the stage reported most often, mostly because it's the easiest to measure and the one databases actually have decent data for. Construction stage (A4 and A5) covers getting the material to the job site and installing it, and smaller assessments skip this one constantly, honestly, because it's a pain to track. Use stage (B1 through B5) covers maintenance, repairs, and replacements over the reference study period, usually 50 to 60 years, while end-of-life (C1 through C4) covers deconstruction, waste handling, transport, and disposal.
Then there's Module D, sitting off to the side by itself. It captures potential credit for reuse, recycling, or energy recovery, but it gets reported separately, never folded into the total. Treat it as a footnote.
One more wrinkle worth knowing about: the European standard behind this framework (EN 15978) is getting an update, expected in 2025, that adds a preconstruction stage (A0) and a building-related user activities stage (B8), and splits Module D into two parts. So the rulebook is getting rewritten while everyone's still using the old edition, which is standard stuff, bureaucratically speaking.
Here's the practical mess this creates. Two LCA reports on the exact same material can show wildly different numbers if one only covers A1 through A3 and the other covers A1 through C4. Neither report is wrong, technically; they're just answering two different questions that happen to look like the same question on the page. The scope disclosure is the actual number you're reading, not the headline figure.
Three ways to run an LCA, and what each one gives up
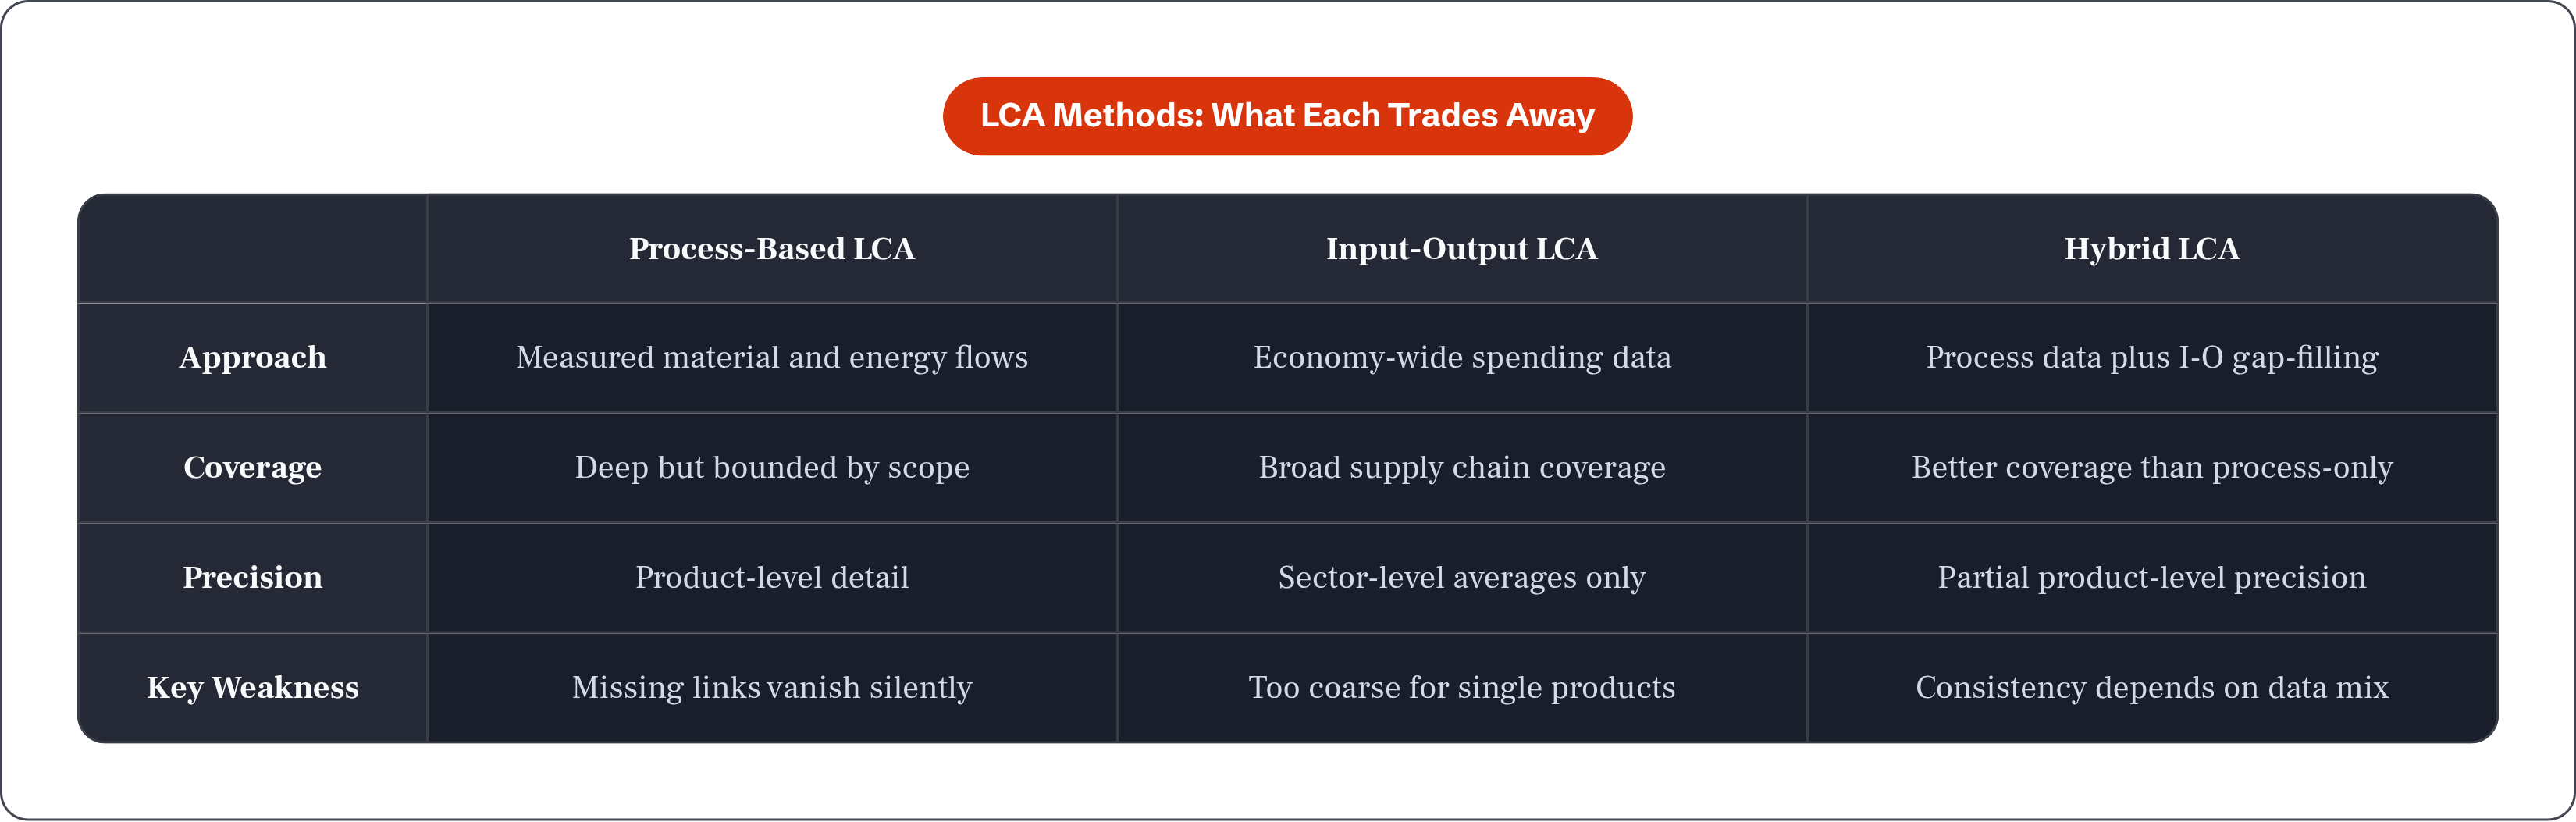
Three methods exist for running a life cycle assessment, and each one trades something away to get something else. There's no free lunch here, and anyone who tells you otherwise is selling something.
Process-based LCA traces material flows and energy use at every stage using measured, real data. It's the most detailed option on the table, and also the slowest and most expensive, and if you miss a piece of the supply chain, that gap just vanishes from the total, no warning light, nothing flags it. Input-output LCA flips the whole approach around: it uses economy-wide spending data to estimate emissions across a supply chain. Faster, broader coverage, but coarse, since you're working off sector averages instead of one product's actual numbers. Hybrid LCA tries to split the difference, using process data where it exists and filling gaps with input-output data, which gets you better supply chain coverage than process-only while keeping some product-level precision intact.
None of these three guarantees an apples-to-apples result on its own. Accuracy comes down to data quality and where someone drew the system boundary, a choice sometimes called the cutoff criterion, and two teams running the same method can still land on two different numbers using the same inputs.
Scale adds a second wrinkle, and this one trips up even people who should know better. A whole-building LCA (WBLCA) rolls every product and assembly up into one building-level figure, while a product-level LCA zooms in on a single material, and these aren't interchangeable, full stop. Any policy comparing materials across categories, concrete versus steel, say, needs a whole-building approach to mean anything at all. Stack two product-level EPDs side by side and call it a comparison, especially when they follow different product category rules, and you've dressed up a misleading answer as a precise one.
What an EPD actually tells you about a material
An Environmental Product Declaration, or EPD, is the document that reports a product's LCA results. Think nutrition label, except instead of calories and sodium, it lists global warming potential, acidification, eutrophication, ozone depletion, and smog formation — a less appetizing label, but a label nonetheless.
Global warming potential (GWP) is the headline number, reported in kilograms or metric tons of CO2 equivalent. Every greenhouse gas gets converted into that CO2e figure using 100-year global warming potentials, so methane doesn't just get shrugged off in the math. At the building level, comparisons usually shift to kgCO2e per square meter of floor area, which lets you line different projects up side by side.
Here's the catch, and it's a real one worth sitting with. EPDs run on product category rules (PCRs), and those rules change by product type and by region. Ready-mix concrete follows different PCRs than structural steel does. So stacking an EPD for one material against an EPD for another isn't a clean comparison, even when both documents look identical on the page: same fonts, same layout, same false sense of apples-to-apples.
Most EPDs only cover A1 through A3, cradle to gate, and use-stage and end-of-life data stay thin across the board, which is why most databases describe manufacturing emissions far better than they describe cradle-to-grave performance. The ICE Database has been one of the biggest sources of generic embodied carbon factors around, downloaded by over 100,000 users worldwide, and it's shifting to educational use only after September 2026. That's going to leave a real gap for teams who lean on it for project-level work, and I don't think the industry has fully reckoned with that yet.
The tools people actually use, and what each is built for
A handful of tools cover most of the real-world work here, and each one is built for a different job. None of them do everything, which is part of why picking the right one matters more than people assume.
EC3, the Embodied Carbon in Construction Calculator, is free, built on EPD data, and best for product selection and procurement, comparing materials inside the same category. Athena Impact Estimator is standalone software for whole-building LCA or assembly-level comparisons, covering structural systems, enclosures, and interiors across every lifecycle stage, with a North American focus. SimaPro and GaBi are the professional-grade options, built for fully custom modeling using Ecoinvent and NREL life cycle inventory data, and they mostly cover A1 through A3, suiting researchers and consultants doing deep material-level work. OneClick LCA Planetary is lighter and web-based, covering 10 common carbon-intensive materials, cradle-to-gate only, better suited for early exploration than a certified project assessment.
Which tool you pick decides which stages get modeled, which background databases feed the emission factors, and whether your results can even talk to someone else's results. A number out of Athena and a number out of SimaPro aren't automatically the same kind of number, even if they look identical sitting next to each other on a spreadsheet.
And no tool escapes the core limitation here: what it can calculate is bounded by what data actually exists. A4 through C4 data is thinner than A1 through A3 on every single platform out there, no exceptions.
What timber-versus-steel studies reveal about scope games
Look at the studies comparing timber, concrete, and steel frames, and the scope problem shows up in the actual numbers, not just in theory. This is where it stops being abstract.
A 2023 peer-reviewed study found embodied carbon intensities of 119 kgCO2e per square meter for timber frames, 185 for concrete, and 228 for steel, nearly double between timber and steel. A 2024 study from the USDA Forest Products Laboratory ran the same comparison and found 198 kgCO2eq per square meter for mass timber versus 243 for steel, a much narrower gap. Same materials, same basic question, asked twice, yet different methodology and different boundary assumptions close the gap almost entirely.
A Monte Carlo analysis of mid-rise buildings in Australia found mass timber ranging from 196 to 590 kgCO2e per square meter, averaging 417, while post-tensioned concrete ranged from 307 to 618, averaging 465. The averages differ by 48 kgCO2e per square meter, sure, but the ranges overlap by a mile. A separate meta-analysis found reinforced concrete buildings carry 42.68% higher average embodied greenhouse gas emissions than mass timber alternatives, a figure that rolls up a pile of studies, each one carrying its own boundary choices baked in quietly, underneath a single tidy percentage.
The spread inside each material tells you almost as much as the spread between materials. Mass timber running from 196 to 590 in one single study is really just a snapshot of how much system boundary, regional data, and one specific accounting choice can move the needle.
That accounting choice is biogenic carbon, and it's a real fight in the field right now, not some academic footnote nobody cares about. Timber stores carbon as it grows through biogenic carbon sequestration, and some studies count that stored carbon as a credit, which can make a wood building look net-negative on paper. Other researchers push back hard on this, arguing temporary storage isn't the same as permanent removal and shouldn't get netted against the total, only reported alongside it. Same building, same materials, yet depending on which side of that argument a study takes, the building reads as either a carbon sink or a carbon source, and nothing about the actual construction changed.
Concrete gets its own callout here, too. The cement industry alone accounts for roughly 7 to 8% of global CO2 emissions, and concrete gets used at such enormous scale worldwide that even small per-unit improvements in how it's made add up to a real dent in the global total, not a rounding error, not by a long shot.
Four questions to ask before you trust any number
Before taking any embodied carbon figure at face value, run it through four questions. Which lifecycle stages does it actually cover? Which tool and database produced it? Does it count biogenic carbon, or leave it out entirely? And what's the reference unit: per square meter, per kilogram, or a whole-building total?
Cradle-to-gate figures (A1 through A3) are the ones you'll run into constantly, and they're also the least complete picture available, which is a little ironic given how often they get treated as gospel. Cradle-to-grave figures (A1 through C4) tell you more, but they lean on end-of-life assumptions that usually don't have real project data behind them, mostly educated guesses dressed up as numbers.
A building's structure and substructure usually dominate its upfront embodied carbon, up to 80% depending on the building type, which means the frame material carries more weight than almost any other single decision on the project. Upfront carbon deserves extra scrutiny for exactly this reason: those emissions are already out the door and into the atmosphere by the time the building opens. No amount of future operational efficiency buys that back, no matter how good the building's ENERGY STAR score ends up looking five years later.
Zoom out far enough, and embodied carbon typically lands somewhere between 20 and 50% of a building's whole-life energy and carbon footprint, once operational emissions get folded back in. Where it falls in that range depends on how clean the grid is, how efficient the building runs, and how many lifecycle stages the assessment actually bothered counting in the first place.
One habit worth building for good: when comparing materials across categories, don't lean on product-level EPDs alone. The product category rules behind them don't line up across product types anyway, so the comparison is broken before you even start. A whole-building LCA that holds performance constant is the fair fight. Any embodied carbon figure that shows up without its scope attached is an unknown fraction of a measurement, dressed up to look finished. Ask for the scope, every time — that's really the whole trick.