Occupancy Analytics in Smart Office Buildings
Real occupancy data reveals what's actually being used, not just what's booked or sensed.
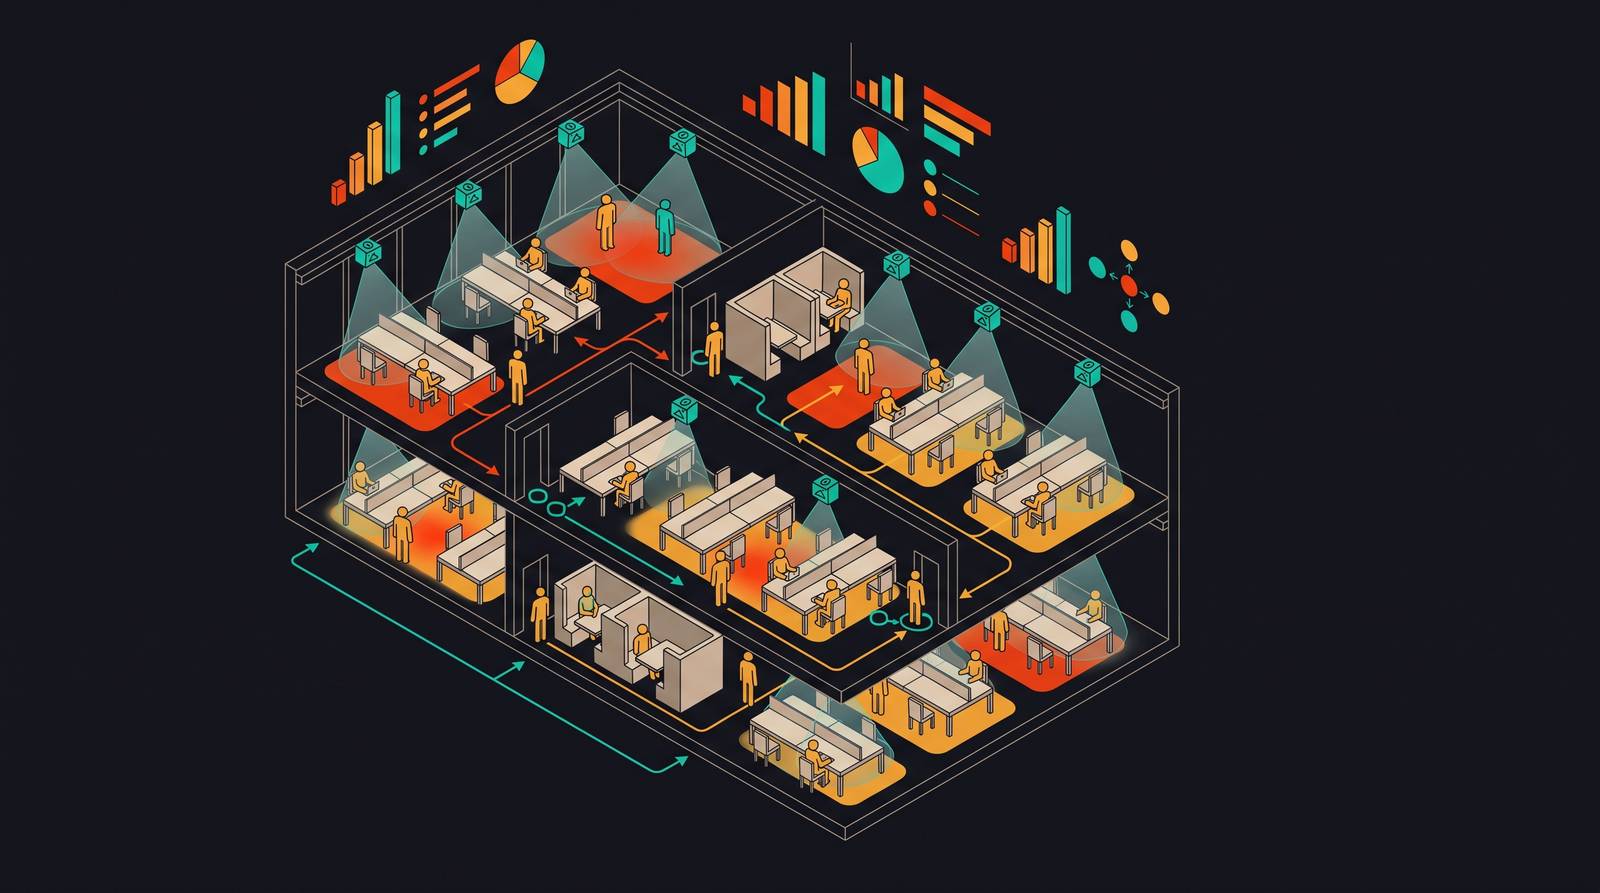
Most people hear "occupancy analytics" and picture someone clicking a tally counter at the entrance. The name sounds like a glorified headcount. Occupancy analytics goes much further than that.
What occupancy analytics actually does is track how physical spaces are used continuously over time. It tells you whether a space has someone in it, how many people, for how long, and how that compares to how many it could hold. The difference between a headcount and that full picture is where expensive mistakes live, like a building that's fully booked on paper but half-empty in reality.
Two problems make this concrete fast.
The first is what the industry calls passive occupancy. Someone leaves a bag on a chair and steps out for the rest of the afternoon. A basic motion sensor sees that bag, registers the desk as occupied, and your utilization number goes up. Your data says the floor is full. The floor is empty.
The second is ghost bookings. Someone reserves a conference room for two hours, takes the call remotely instead, and that room sits completely empty while your system shows it as booked. It hides real availability and makes your space look more constrained than it actually is. Ghost bookings happen constantly, and organizations plan around space that was never really in use.
A space utilization rate is only worth anything if it answers four questions at once:
Is the space actually occupied, or just physically blocked by someone's belongings?
How many people are in it?
How long have they been there?
How does that compare to what the space can actually hold?
Miss any one of those, and you are measuring something that looks like occupancy data but falls short. That gap surfaces at the worst possible time, like right after you sign a lease renewal you did not actually need.
The Sensor Layer: How Raw Presence Becomes Structured Data
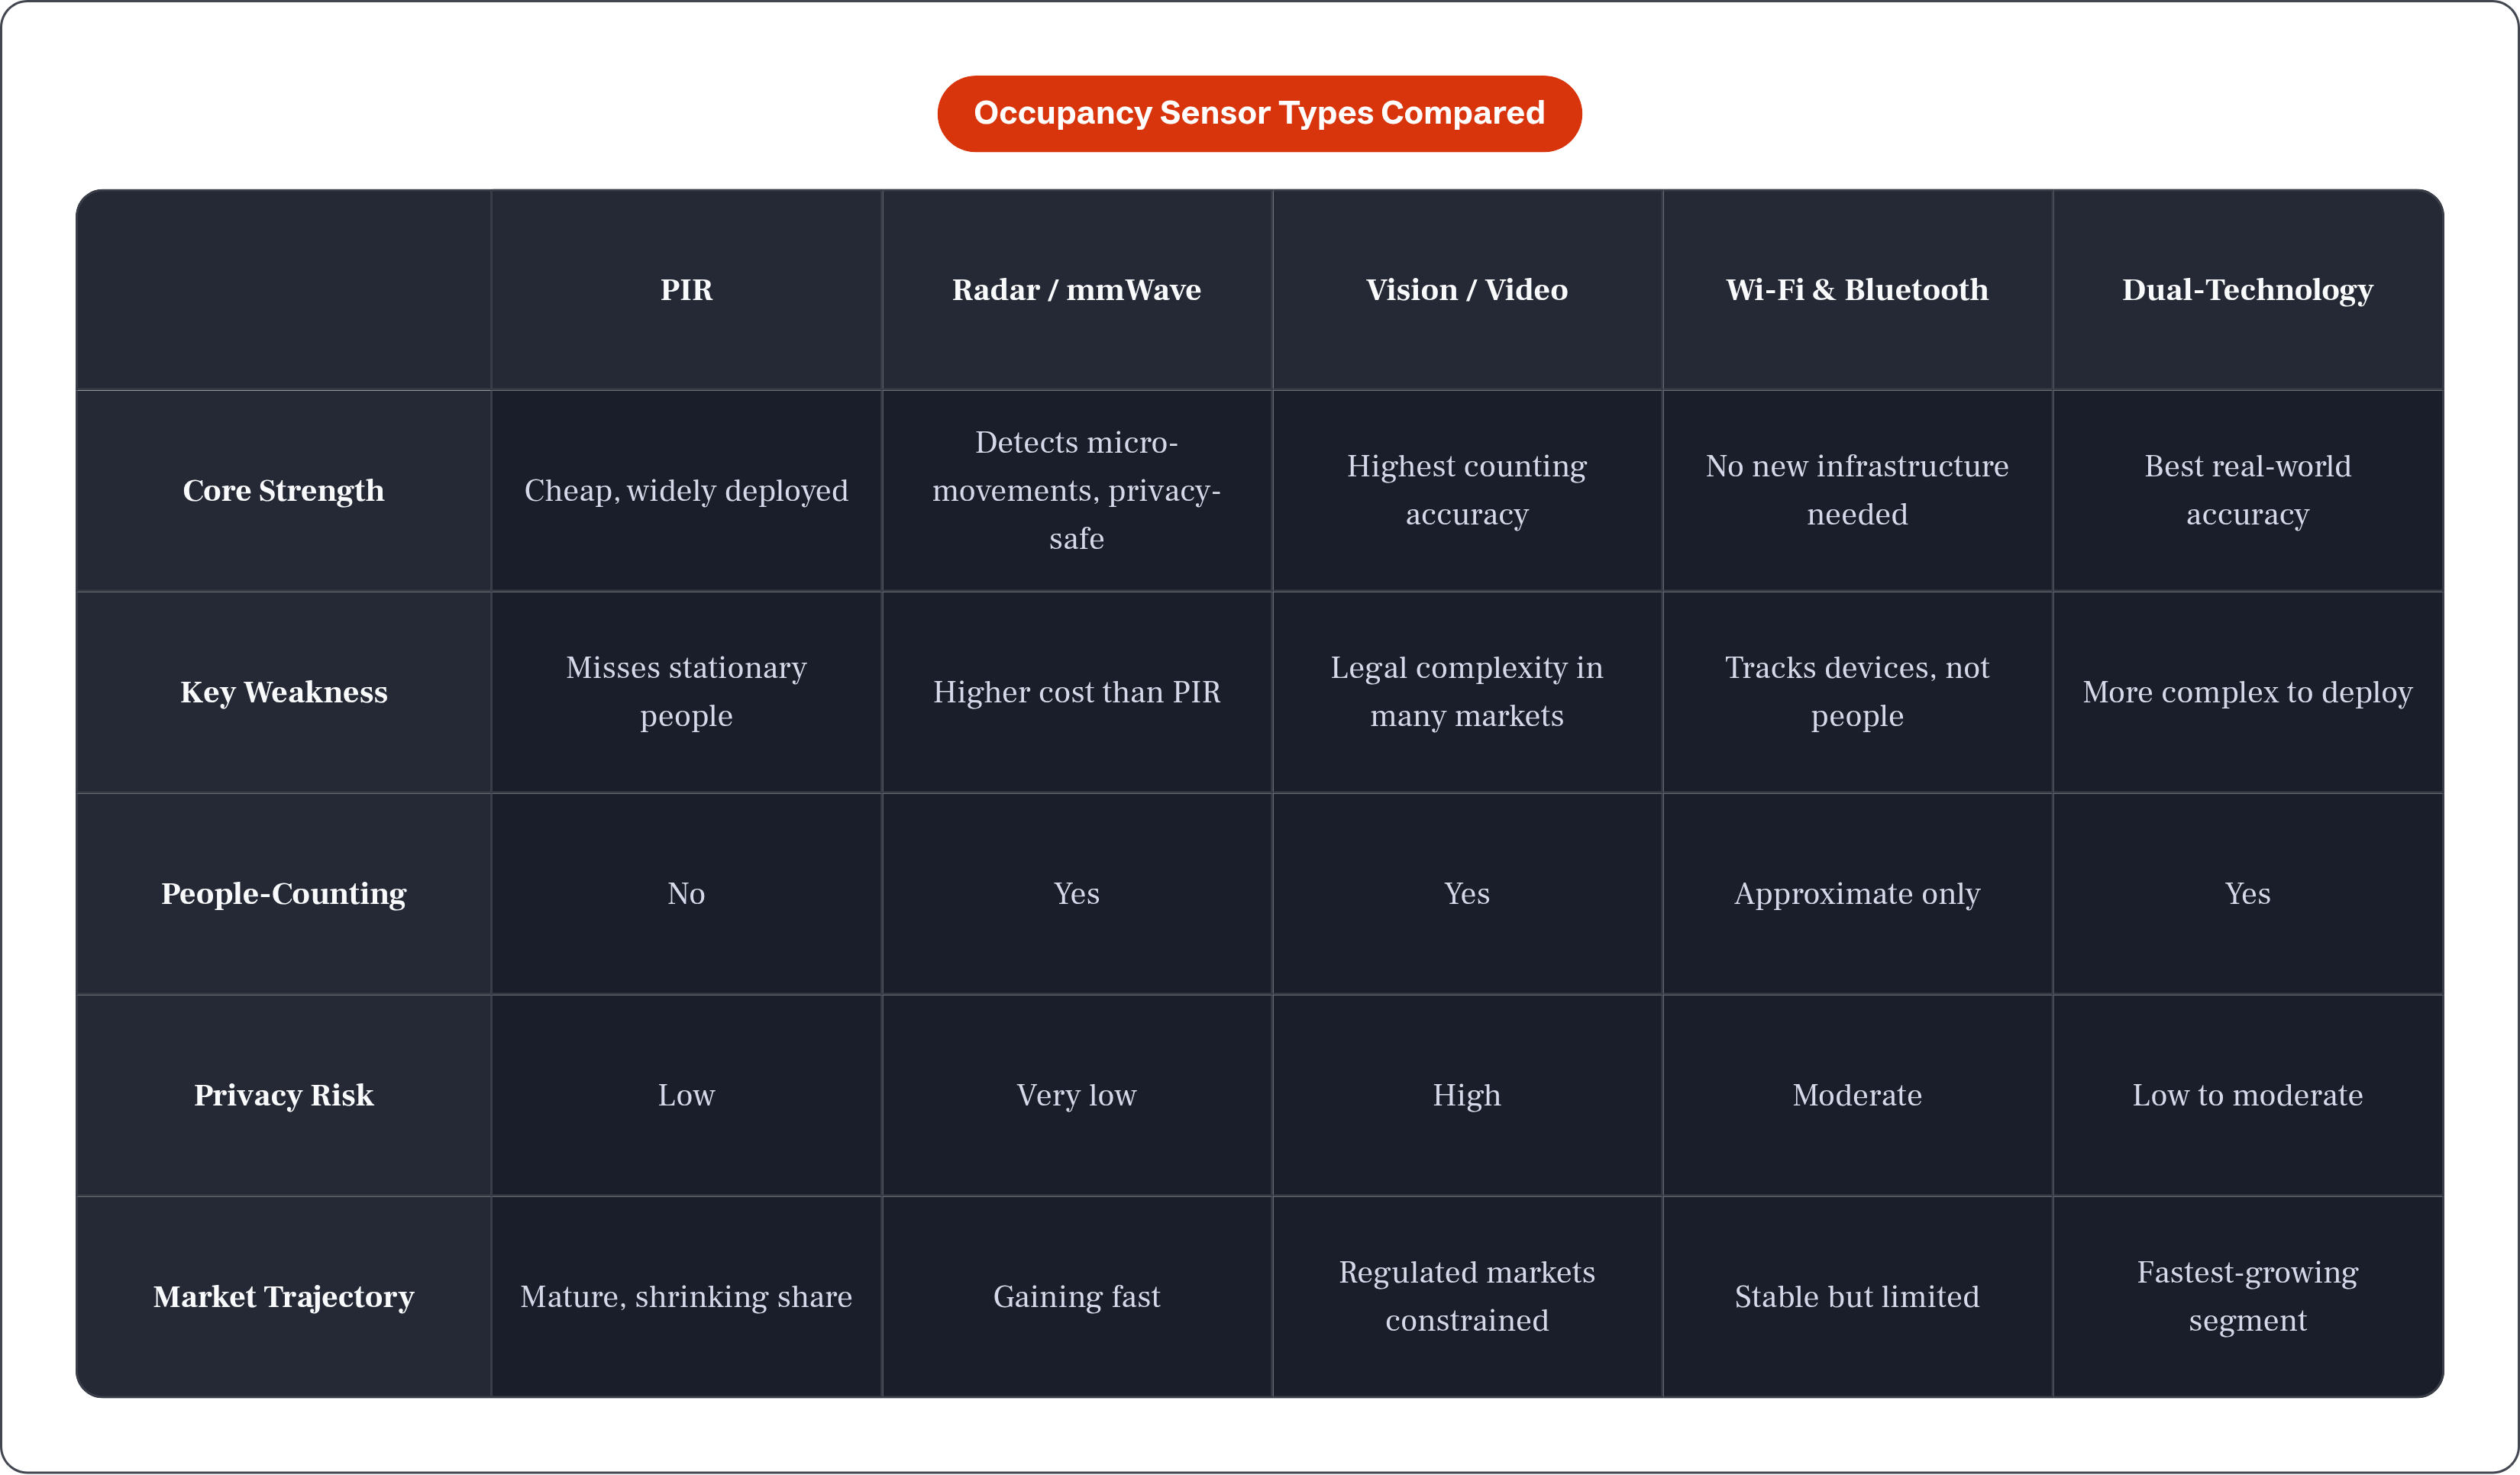
There is no shortage of ways to detect a person in a room. The hard part is doing it accurately, at scale, without creating a privacy situation your legal team surfaces six months post-installation.
Here is what is actually deployed in buildings right now:
Passive infrared (PIR). Detects heat movement. Cheap and widespread. As of 2025, PIR holds roughly half the occupancy sensor market. Its core weakness is that it misses stationary people and cannot count how many occupants are present.
Ultrasonic sensors. Emit sound waves and read reflections. Better than PIR at catching someone sitting still, but HVAC airflow can trigger false positives.
Radar and mmWave. Can detect breathing and micro-movements, works through furniture, and produces no identifiable image. Growing fast as a privacy-safe option for per-desk monitoring.
Thermal imaging. Counts heat signatures without capturing faces. Good on privacy, less precise in dense configurations.
Vision and video. The most accurate option for counting and behavior analysis, and the most legally complicated depending on jurisdiction.
Wi-Fi and Bluetooth device tracking. Cheap to deploy because the infrastructure already exists. It tracks devices rather than humans, so a laptop left on a desk reads as a person present.
Dual-technology sensors are the fastest-growing segment, which reflects something honest about where the industry stands. No single sensor type has solved the accuracy problem, and the market has stopped pretending it will. Pairing methods is where real accuracy lives.
Honeywell's 2026 Metrologic Series 4 pairs radar with PIR and runs machine learning directly on the device, processing data locally rather than sending raw signals to the cloud. That matters for response speed and privacy. Signify's Interact Office platform shows how sensor data and calendar data can work together, pulling per-desk sensor readings alongside Microsoft 365 calendar entries to surface ghost bookings directly. If a room is booked and sensors show nobody there, the system flags it without waiting for a facilities manager to check.
Once sensors collect data, signals move over low-power wireless protocols like Bluetooth Low Energy, Zigbee, or LoRaWAN to a local gateway, which pushes data to a cloud analytics layer where interpretation actually happens.
How the Analytics Platform Turns Sensor Signals Into Decisions
A sensor on its own produces one of two outputs: occupied or vacant. The platform is what turns thousands of those binary signals into something a real estate team can act on.
What a mature platform produces:
Real-time heatmaps showing which zones are busy now and which floors are empty mid-afternoon.
Time-series utilization charts showing how usage has trended over days, weeks, and months.
Peak and off-peak patterns showing when spaces actually fill up versus when they sit empty regardless of how many rooms are booked.
Desk-vs-room-vs-zone breakdowns. Zone-level data works for floor planning. Desk-level data is what you need for hoteling and desk-sharing ratios. These are different use cases and the data is not interchangeable.
Booking-vs-actual-attendance gaps that finally put the ghost booking problem into a number someone can report on.
The real differentiator right now is data fusion. Platforms that combine sensor signals with access control badge reads, Wi-Fi logs, calendar systems, and HR data produce a materially more accurate picture than any single source. Basking takes this multi-signal approach seriously, unifying Wi-Fi, access control, and sensor feeds into one analytics layer with AI-driven analysis and portfolio-wide benchmarking. VergeSense built its Meridian analytics layer to transform sensor streams into workplace-scale intelligence, with a focus on making data actionable rather than just visible. Tango Occupancy approaches this from a portfolio planning angle, designed for organizations making bigger calls about how much space they actually need across multiple buildings.
Some platforms now run analytics directly on the sensor or gateway device, detecting anomalies and triggering local actions like HVAC adjustments without a cloud round-trip. For building control integrations where response time matters, that local processing changes what the system can actually do.
Space Optimization: What Utilization Data Makes Possible
Occupancy data enables decisions at three distinct levels, and the stakes are different at each one.
At the desk level, utilization data is what makes desk-sharing models workable rather than just philosophically attractive. Assigned seating dropped from 83% to 55% of companies per CBRE benchmarking, while hybrid desk-sharing models surged from 12% to 36%. That shift only makes operational sense if you know how many desks you actually need on any given day. Without real utilization data, hotdesking ratios are guesses. CBRE data shows that sharing ratios are now informed by space-utilization data at 78% of organizations.
At the floor level, the data informs layout redesign. Which zones are full of individual desks when people actually want collaborative space? Which meeting rooms are consistently oversized for the groups that use them? You cannot answer those questions by walking the floor once a quarter. You can answer them with six months of sensor data showing how every square foot was used.
At the portfolio level, the stakes get large fast. Organizations with reliable utilization data across multiple sites can make the call to consolidate leases, exit buildings, or renegotiate terms from a position of actual evidence. Tango Occupancy has a concrete example: one enterprise client reduced Munich office space by 10% based on utilization data, saving hundreds of thousands of euros per year. Utilization rate is the most tracked metric across commercial real estate teams at 83% of organizations per CBRE, and increasing office utilization is a top goal for 81% of them.
Energy Reduction: How Occupancy Data Cuts Waste
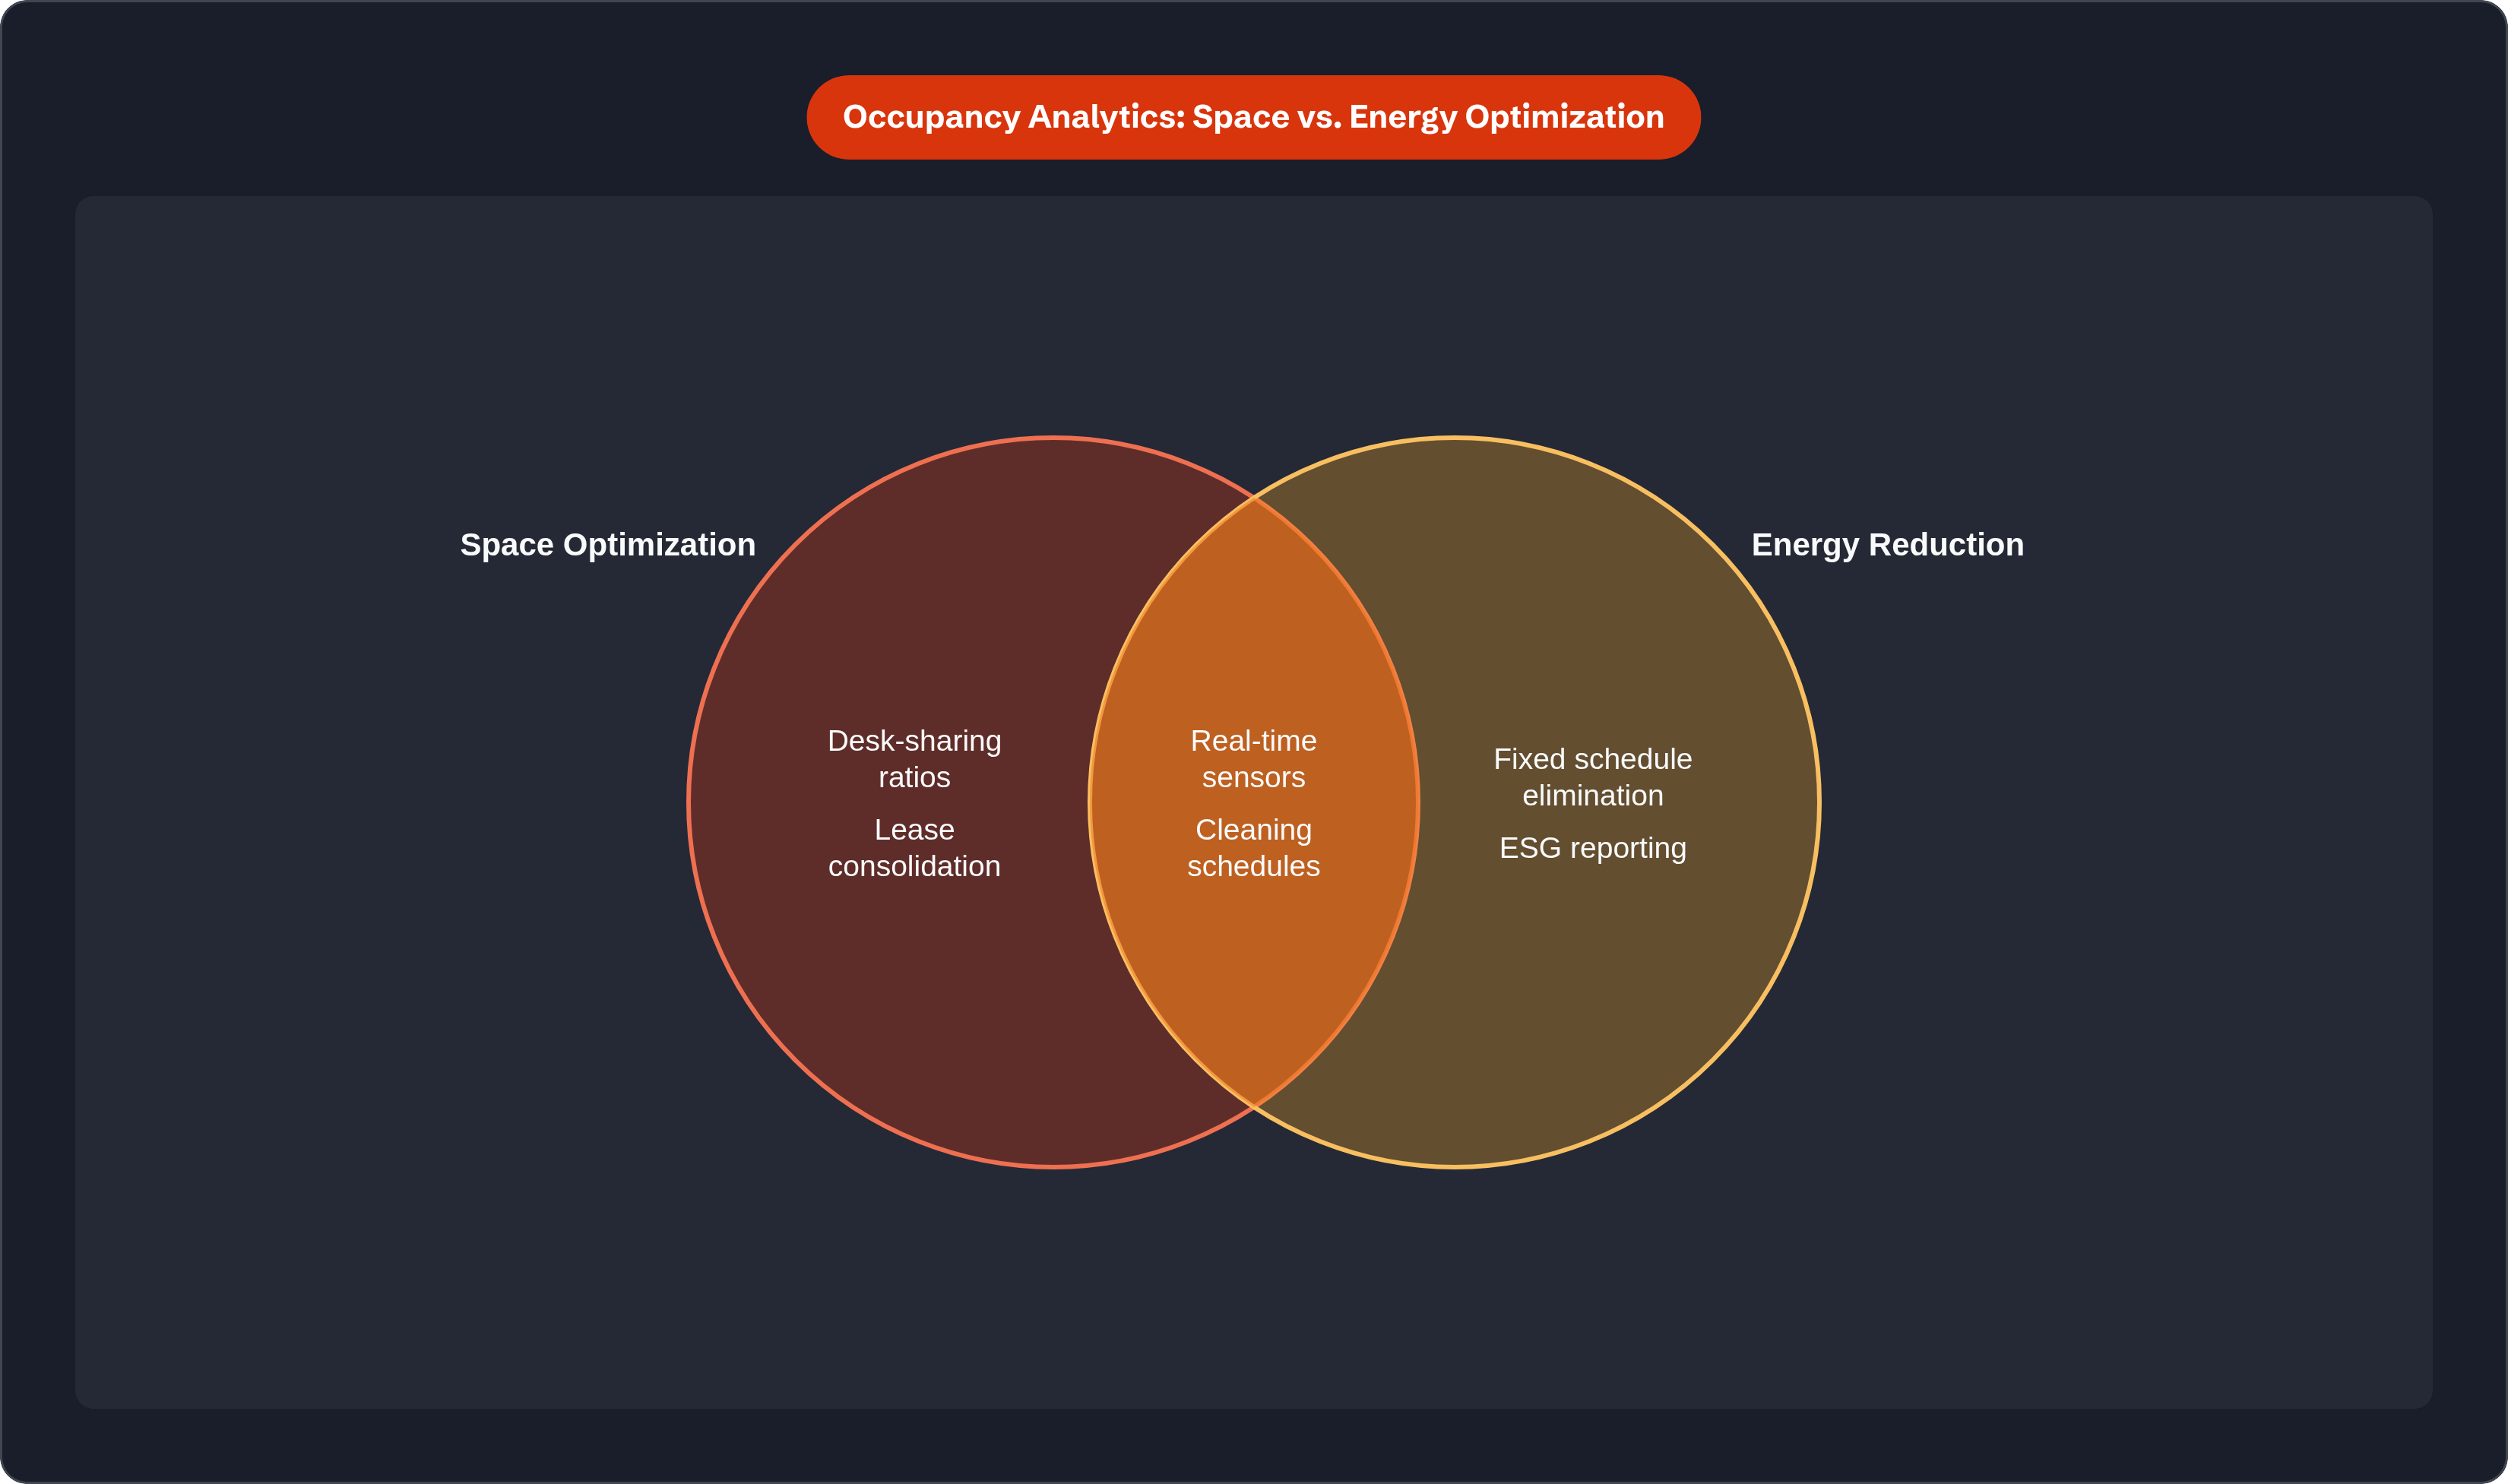
Most commercial buildings still run HVAC and lighting on fixed schedules built around an assumption of near-full occupancy, typically 8am to 6pm regardless of what is actually happening in the building. With hybrid attendance patterns, that assumption has become quietly expensive. You are conditioning space for people who are absent.
Switching to demand-controlled ventilation based on real-time sensor data reduces fan energy and over-ventilation without any noticeable change in comfort for the people actually present. Schneider Electric's global research found that occupancy-based control solutions reduce office energy use and carbon emissions by an average of roughly one-fifth. For a large commercial portfolio, that is a significant budget line rather than a marginal improvement.
The sustainability angle adds a compliance dimension worth taking seriously. Occupancy data gives organizations a credible, auditable way to quantify and report energy reductions for ESG disclosures and Scope 1 emissions reporting. As reporting requirements tighten globally, having that documentation built into your system matters more than it used to.
One of the most straightforward applications is cleaning schedules. Instead of cleaning every room on a fixed rotation, facilities teams can trigger cleaning only when sensor data shows a space has actually been used, reducing labor cost and waste.
Where Utilization Data Falls Short
None of this works if the underlying data is bad, and the data goes bad in more ways than most sales cycles will walk you through.
Sensor coverage gaps. A sparse deployment gives you an incomplete picture. If you have sensors in conference rooms but not at individual desks, you cannot make desk-sharing decisions with any real confidence. Per-desk resolution requires denser sensor grids, which cost more. Many organizations under-invest here and then spend months confused about why their utilization numbers feel off.
The passive occupancy problem. If your sensors cannot distinguish a person from a coat draped over a chair, your utilization figures are systematically inflated. Over-reporting occupancy is just as damaging as under-reporting it, because it leads you to believe you have less space than you do and make decisions accordingly.
Integration gaps. The "single source of truth" that most platforms promise requires those platforms to actually connect to your HVAC systems, HR tools, calendar apps, and lease databases. In practice, that integration is harder than the vendor demo suggests and requires ongoing maintenance and organizational alignment across IT, facilities, and real estate teams.
The organizational change problem. JLL's 2026 Global Occupancy Planning Benchmark, covering 84 organizations and 716 million square feet of space, found that the gap between actual and target utilization narrowed from 25 percentage points in 2025 to 18 percentage points in 2026, but actual utilization still sat at 56% against a target of 74%. The platform gives you the map. Getting people to actually change how they work and how they book space is a change management problem that the software cannot solve for you.
Privacy constraints. Video-based sensors face real regulatory exposure in Europe and in certain U.S. jurisdictions. Radar and thermal sensors sidestep many of these concerns, which is part of why they keep gaining share despite being more expensive.
Market Development and What Drives Adoption in 2025 and 2026
The smart office occupancy analytics market hit USD 3.42 billion in 2024, with projections toward USD 10.44 billion by 2033 at a compound annual growth rate of 13.7%. North America leads current market size. Asia Pacific is the fastest-growing region. Global average building utilization reached 53% in 2025, up from 38% in 2024 per CBRE data. As buildings fill up again, the pressure to use space efficiently increases, and organizations are paying for space they only partially use.
On the hardware side, dual-technology sensors and mmWave radar are gaining share as accuracy requirements tighten. Wireless is the fastest-growing deployment method, driven by retrofit projects in existing buildings where running new cable is prohibitively expensive. At the platform layer, AI integration is where competitive differentiation is happening. Basic utilization dashboards have become table stakes, and the platforms pulling ahead are the ones embedding intelligence into the data layer itself rather than just presenting numbers. The structural direction of the market is consolidation around integrated platforms that connect to building management, HR, lease management, and enterprise calendar infrastructure.
What to Look for When Evaluating Occupancy Analytics Platforms
Sensor agnosticism vs. proprietary lock-in. Some platforms only ingest data from their own sensors. Others work with whatever hardware you already have. If you have existing sensor infrastructure, proprietary lock-in is an expensive problem to discover after signing a contract.
Data fusion capability. Can the platform combine sensor data with badge reads, calendar data, Wi-Fi logs, and access control feeds? Single-signal platforms are cheaper and faster to deploy but less accurate in the ways that matter when you are making real estate decisions.
Granularity vs. coverage. Per-desk sensor coverage gives you the data to set desk-sharing ratios with confidence but costs significantly more than zone-level coverage. Zone-level data is fine for floor planning and energy optimization. It is insufficient for hoteling decisions. Be honest about which decisions you are actually trying to make before deciding what resolution you need.
Integration depth. A dashboard is an output. Integration is what connects it to action. Ask whether the platform connects to your HVAC controllers, lighting systems, HR software, and lease management tools in ways that trigger automated action, or whether it produces reports that someone has to read and manually act on.
Privacy and compliance before cost. Determine which sensing technologies are legally deployable in your specific jurisdictions before the first purchase order. Video-based systems face very different regulatory exposure than radar or thermal options, and revisiting this after deployment is far more costly than addressing it upfront.
Run a pilot first. Pick one floor or one building. Define a utilization baseline before you turn anything on. Measure against it for 60 to 90 days. Fix data-quality problems at that scale before you try to run it across a portfolio. Organizations that rush to enterprise-wide deployment and then discover systematic sensor inaccuracies or integration failures end up with data that nobody believes, and ignored data is an expensive outcome.